
|
360 One Wam Limited (360ONE.NS): BCG Matrix [Apr-2026 Updated] |
Fully Editable: Tailor To Your Needs In Excel Or Sheets
Professional Design: Trusted, Industry-Standard Templates
Investor-Approved Valuation Models
MAC/PC Compatible, Fully Unlocked
No Expertise Is Needed; Easy To Follow
360 One Wam Limited (360ONE.NS) Bundle
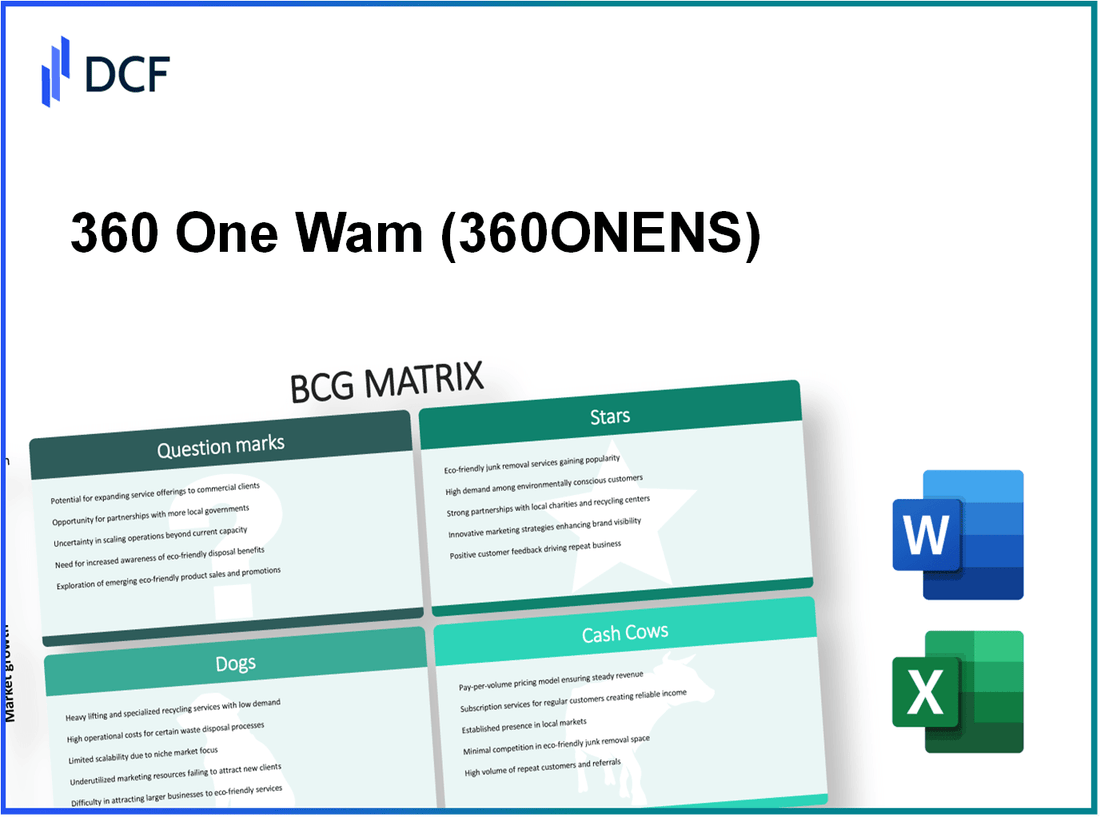
360 ONE WAM's portfolio is powered by high-growth Stars-alternative investment funds, discretionary PMS and multi-family office services-while mature Cash Cows like core wealth distribution, 360 ONE Prime lending and institutional equities fund the group; several Question Marks (global offshore, 360 ONE Plus digital push and estate planning) demand disciplined capital and execution to become future Stars, and clear Dogs (legacy retail brokerage, non-core proprietary investments and physical branches) are slated for wind-down or divestment-a mix that forces tough allocation choices between doubling down on premium wealth offerings and funding risky digital and offshore expansion.
360 One Wam Limited (360ONE.NS) - BCG Matrix Analysis: Stars
Stars
The Alternative Investment Funds (AIF) segment serves as a primary Star for 360 ONE, delivering rapid growth and high profitability within the private wealth ecosystem. Annual market expansion for the AIF channel in India exceeds 25 percent, and as of late 2025 this unit manages over INR 82,000 crore in assets, representing an 18 percent market share within the private wealth category. Yield metrics for the AIF distribution model average approximately 1.55 percent-materially above traditional mutual fund distribution yields-while operating margin stands at 48 percent. The unit contributes roughly 24 percent to consolidated revenue and requires ongoing capital expenditure to support product innovation, regulatory compliance, and digital onboarding platforms.
| Metric | Value | Comment |
|---|---|---|
| AUM (AIF) | INR 82,000 crore | As of late 2025 |
| Market Growth Rate (AIF) | >25% p.a. | Indian AIF expansion |
| Market Share (AIF) | 18% | Private wealth category |
| Yield (AIF) | ~1.55% | Distribution model yield |
| Operating Margin (AIF) | 48% | High-margin product mix |
| Revenue Contribution | ~24% | Consolidated revenue |
| Key Investment Needs | Product R&D, digital onboarding | Ongoing CAPEX |
Strategic implications for the AIF Star include prioritizing product innovation, scaling digital client acquisition, tightening risk oversight for alternative strategies, and allocating capital to distribution and regulatory compliance to protect market share and margins in a rapidly expanding segment.
The Discretionary Portfolio Management Services (DPMS) unit is a high-growth Star driven by UHNI demand for professional mandates. Assets under management increased 32 percent year-on-year, reaching INR 55,000 crore by December 2025. The unit commands a 12 percent share of the organized discretionary market while delivering a return on equity of 26 percent. Its cost-to-income ratio is 42 percent, enabling aggressive reinvestment into research, portfolio engineering, and talent acquisition. DPMS now contributes approximately 15 percent of the firm's total fee income, underscoring sustained client adoption and pricing power.
| Metric | Value | Comment |
|---|---|---|
| AUM (DPMS) | INR 55,000 crore | Dec 2025 |
| YoY AUM Growth | 32% | Organized discretionary expansion |
| Market Share (DPMS) | 12% | Organized discretionary space |
| Return on Equity | 26% | Strong profitability |
| Cost-to-Income Ratio | 42% | Operational efficiency |
| Fee Income Contribution | ~15% | Firm's total fee income |
| Key Investment Needs | Research, talent, technology | Support scalable PM mandates |
- Invest in quantitative and discretionary research to sustain alpha generation.
- Scale client acquisition for UHNI segments via bespoke reporting and family governance integration.
- Enhance portfolio construction technology to improve margins and client retention.
The Multi Family Office (MFO) division has scaled rapidly as ultra-wealthy families seek consolidated wealth governance, estate planning, and strategic advisory. Client count grew 35 percent, now serving over 150 families with a platform AUM of INR 45,000 crore. The MFO operates with a premium fee structure delivering a net profit margin of 38 percent, outpacing typical advisory margins. Market share within the specialized family office niche is approximately 15 percent. The segment contributes about 10 percent to the overall wealth management revenue and requires increased CAPEX for bespoke technology, secure communication channels, and succession-planning tools.
| Metric | Value | Comment |
|---|---|---|
| Client Count Growth | +35% | Rapid expansion in families served |
| Clients Served | 150+ families | High-touch relationships |
| AUM (MFO) | INR 45,000 crore | Platform AUM |
| Market Share (MFO niche) | 15% | Specialized family office space |
| Net Profit Margin | 38% | Premium fee structure |
| Wealth Revenue Contribution | ~10% | Firm's wealth management revenue |
| Key Investment Needs | Bespoke tech, secure comms, succession tools | To support bespoke client services |
- Prioritize secure, bespoke technology platforms and client portals for high-net-worth clients.
- Develop integrated estate, tax, and governance solutions to deepen wallet share per family.
- Allocate strategic CAPEX for customized service delivery and talent with family-office expertise.
360 One Wam Limited (360ONE.NS) - BCG Matrix Analysis: Cash Cows
Cash Cows
The Wealth Management Distribution business is the primary cash generator for 360 One Wam Limited. It holds a 20% share of the Indian UHNI market and manages AUM of approximately INR 3.9 lakh crore as of December 2025. This segment achieves a return on equity (ROE) of 24% while requiring minimal incremental capital expenditure to sustain its market position. Revenue contribution from this business is 52% of the group's total, with a client retention rate of 98%, producing stable, predictable cash inflows that fund investments into higher-growth units within the firm.
| Metric | Value | Notes |
|---|---|---|
| UHNI Market Share | 20% | Market share within Indian UHNI segment (Dec 2025) |
| AUM | INR 3.9 lakh crore | Aggregate assets under management (Dec 2025) |
| ROE | 24% | Return on equity for wealth distribution business |
| Revenue Contribution | 52% | Share of group revenue |
| Client Retention | 98% | Annual retention among existing clients |
360 ONE Prime (NBFC lending) functions as a cash-generative lending arm with a focus on lending against securities and structured credit. The loan book stands at approximately INR 7,500 crore with a net interest margin (NIM) of 4.2% for the current fiscal period. The segment contributes roughly 18% to group profit before tax, operates in a mature market with ~10% growth, and posts a gross NPA ratio of 0.15%, indicating high asset quality. Capital demands are largely regulatory and liquidity-driven rather than for market share expansion, aligning it with classic Cash Cow characteristics.
| Metric | Value | Notes |
|---|---|---|
| Loan Book | INR 7,500 crore | Outstanding loans (current fiscal) |
| Net Interest Margin (NIM) | 4.2% | Net interest income as percentage of earning assets |
| Contribution to PBT | 18% | Share of profit before tax |
| Gross NPA | 0.15% | Asset quality indicator |
| Market Growth | 10% p.a. | Mature market growth rate |
The Institutional Equities segment maintains a steady market presence in a saturated brokerage market. Serving over 400 institutional clients, it commands a 4% share of daily trading volume on major Indian exchanges and reports an operating margin of 22%. Revenue growth is modest at 6% annually, and the segment contributes approximately 8% to total company revenue. Its consistent profitability supports corporate overheads and provides liquidity without major capital allocation.
| Metric | Value | Notes |
|---|---|---|
| Institutional Clients | 400+ | Active institutional relationships |
| Market Share (Daily Volume) | 4% | Share of daily trading volumes on major exchanges |
| Operating Margin | 22% | Segment operating profitability |
| Revenue Growth | 6% p.a. | Annual nominal growth rate (2025) |
| Revenue Contribution | 8% | Share of group revenue |
Implications for capital allocation:
- Core cash flows from Wealth Management Distribution (52% revenue) should be used to fund product development and marketing for high-growth units while preserving liquidity buffers.
- 360 ONE Prime's steady interest margins and low credit costs justify conservative capital allocation focused on regulatory liquidity and risk-adjusted origination rather than aggressive expansion.
- Institutional Equities can sustain corporate overheads and technology investments; incremental capital should be modest and targeted at automation and client retention.
- Maintain dividend capacity and share buyback flexibility given combined high ROE and low incremental capex requirements across cash cow segments.
360 One Wam Limited (360ONE.NS) - BCG Matrix Analysis: Question Marks
Dogs (treated here as Question Marks developing into potential Stars) - detailed assessment of three nascent, high-growth but low-share business units within 360 ONE: Global Offshore Wealth, 360 ONE Plus, and Estate & Succession Planning. Each unit operates in segments with above-average market growth but currently low relative market share and varied capital intensity, ROI and margins.
Global Offshore Wealth expansion shows potential: the offshore advisory market is growing at an estimated 22% CAGR driven by Indian HNI demand for geographic diversification. 360 ONE's current market share in this segment is under 4%. Initial CAPEX requirements include regulatory licensing, physical offices in Dubai and Singapore, and compliance infrastructure. Customer acquisition costs are high, producing a current ROI of approximately 9% and payback periods beyond 5 years under current economics. Management targets AUM growth of 45% YoY as a tipping-point metric to justify incremental capital deployment.
| Metric | Value |
|---|---|
| Market CAGR | 22% |
| 360 ONE Market Share | <4% |
| Target AUM Growth | 45% YoY |
| CAPEX Requirements (est.) | INR 60-90 crore (licensing, offices, compliance) |
| Current ROI | ~9% |
| Customer Acquisition Cost (per HNI) | INR 6-10 lakh |
| Payback Period (current) | >5 years |
360 ONE Plus targets mid-market: the mass-affluent/digital wealth segment is expanding at ~30% annually. The platform's present penetration is roughly 2% of the addressable digital wealth market. The company has committed INR 150 crore in CAPEX and marketing to scale technology, build brand awareness and subsidize acquisition. Operating margins are currently negative at -12% as the firm prioritizes growth; unit economics assume margin improvement to breakeven within 36-48 months conditional on achieving a critical user base and 2-3x assets per user versus current levels.
- Market CAGR: 30%
- Current Market Share: ~2%
- Allocated CAPEX: INR 150 crore
- Operating Margin: -12%
- Breakeven Timeline Target: 36-48 months
- Key Risk: intense fintech competition and price-led customer acquisition
| Metric | Value |
|---|---|
| Initial Users | ~85,000 (monthly active users: ~28,000) |
| Average AUM per User | INR 0.9 lakh |
| Marketing Spend (annual) | INR 40-55 crore |
| Expected AUM Growth (if scale achieved) | 60-80% YoY |
| Projected ROI (post-scale) | 15-22% |
Estate and Succession Planning gains traction: operating in a niche with ~18% market growth as wealth transfer priorities rise among older HNIs. 360 ONE's market share in this advisory niche is roughly 5% and revenue contribution is below 3% of group turnover. The service requires hiring specialized legal and tax professionals, keeping cost-to-income ratios elevated at ~65% during initial scaling. ROI is modest at ~11% presently; the segment is strategically important for client retention and cross-selling, with potential to increase lifetime client value if bundled with core wealth management services.
| Metric | Value |
|---|---|
| Market CAGR | 18% |
| 360 ONE Market Share | ~5% |
| Revenue Contribution to Group | <3% |
| Cost-to-Income Ratio | ~65% |
| Current ROI | ~11% |
| Specialist Hires Required (est.) | 30-45 FTEs (legal/tax/estate planners) |
Cross-segment quantitative snapshot for internal capital allocation and decision-making:
| Segment | Market CAGR | Current Share | CAPEX Committed (INR crore) | Current ROI | Operating Margin |
|---|---|---|---|---|---|
| Global Offshore Wealth | 22% | <4% | 60-90 | 9% | ~8-12% |
| 360 ONE Plus | 30% | ~2% | 150 | Negative | -12% |
| Estate & Succession | 18% | ~5% | 20-35 | 11% | ~10% |
Recommended strategic actions (operational levers under consideration):
- Prioritize incremental CAPEX to Global Offshore Wealth only if quarterly AUM growth >30% and customer acquisition cost falls <INR 4 lakh within 8 quarters.
- Scale 360 ONE Plus conditional on achieving a 3x CAC payback improvement via referral, partnerships, or stricter cohort targeting.
- Invest selectively in Estate & Succession talent to lower cost-to-income toward 50% while bundling services to raise cross-sell revenue >10% of segment sales.
- Use a stage-gated funding model across all three units with quarterly KPI milestones (AUM growth, CAC, margin trajectory, client retention) for further capital allocation.
360 One Wam Limited (360ONE.NS) - BCG Matrix Analysis: Dogs
Question Marks - Dogs
The legacy retail brokerage arm operates in a saturated market where discount brokers have captured over 75% of active trading volume. This segment's market share has dwindled to less than 1.5% as the company shifts focus toward high-net-worth advisory services. Revenue growth in this unit has stagnated at 3% in 2025, well below the broader financial services sector. High operating costs and a low net margin of 11% limit strategic value; capital allocation to this unit has been reduced by 35% year-on-year.
The non-core proprietary investment book comprises legacy assets misaligned with the firm's fee-based wealth management strategy. These investments represent under 2% of total assets and delivered an ROI of 6% over the last 12 months. The market for these legacy private equity holdings is illiquid, producing a growth rate of 2% for the segment. No CAPEX is planned as the firm is actively pursuing divestment to free up capital.
The physical branch network for retail distribution is becoming obsolete in an increasingly digital-first Indian financial market. Market share in the retail mutual fund segment has dropped to 0.5% as customers migrate to direct digital platforms. Operating costs for physical infrastructure yield a thin profit margin of 8%, and segment revenue declined by 5% year-on-year. The unit is being phased out in favor of the 360 ONE Plus digital initiative.
| Dog Segment | Market Share | Revenue Growth (2025) | Net/Segment Margin | Asset / % of Total | ROI (12m) | CAPEX Allocation | Strategic Action |
|---|---|---|---|---|---|---|---|
| Legacy Retail Brokerage | <1.5% | +3% | Net margin 11% | - | - | Reduced by 35% | Deprioritise; reallocate capital to HNW advisory |
| Non-core Proprietary Investments | <2% of assets | +2% | - | 1.5%-2% of total assets | ROI 6% | 0% (no planned CAPEX) | Divestment; free up capital |
| Physical Branch Network | 0.5% (retail MF) | -5% YoY | Profit margin 8% | - | - | Reduced; reallocate to digital | Phase-out; migrate customers to 360 ONE Plus |
Implications and immediate priorities for these Dog segments:
- Accelerate divestment of non-core proprietary holdings to release ~1.5%-2% of asset base and redeploy capital to fee-based wealth management.
- Continue capital reallocation away from legacy retail brokerage (current reduction: 35%) toward high-margin HNW advisory and digital growth initiatives.
- Execute branch rationalisation: reduce physical footprint, cut operating costs, and transition remaining retail clients to the 360 ONE Plus platform.
- Reduce management bandwidth spent on low-return units with ROI below corporate Hurdle Rate (example: ROI 6%).
Key metrics to monitor during wind-down and reallocation:
- Divestment target proceeds and timing (target: monetise <2% asset base within 12-24 months).
- Cost-to-income improvements from branch closures (target: improve group margin by 1-2 percentage points within 12 months).
- Client migration metrics to 360 ONE Plus (target retention ≥85% of migrated retail clients).
- Redeployed capital utilisation and return profile (target ROI > corporate hurdle post- redeployment).
Disclaimer
All information, articles, and product details provided on this website are for general informational and educational purposes only. We do not claim any ownership over, nor do we intend to infringe upon, any trademarks, copyrights, logos, brand names, or other intellectual property mentioned or depicted on this site. Such intellectual property remains the property of its respective owners, and any references here are made solely for identification or informational purposes, without implying any affiliation, endorsement, or partnership.
We make no representations or warranties, express or implied, regarding the accuracy, completeness, or suitability of any content or products presented. Nothing on this website should be construed as legal, tax, investment, financial, medical, or other professional advice. In addition, no part of this site—including articles or product references—constitutes a solicitation, recommendation, endorsement, advertisement, or offer to buy or sell any securities, franchises, or other financial instruments, particularly in jurisdictions where such activity would be unlawful.
All content is of a general nature and may not address the specific circumstances of any individual or entity. It is not a substitute for professional advice or services. Any actions you take based on the information provided here are strictly at your own risk. You accept full responsibility for any decisions or outcomes arising from your use of this website and agree to release us from any liability in connection with your use of, or reliance upon, the content or products found herein.