
|
HDFC Bank Limited (HDFCBANK.NS): SWOT Analysis [Apr-2026 Updated] |
Fully Editable: Tailor To Your Needs In Excel Or Sheets
Professional Design: Trusted, Industry-Standard Templates
Investor-Approved Valuation Models
MAC/PC Compatible, Fully Unlocked
No Expertise Is Needed; Easy To Follow
HDFC Bank Limited (HDFCBANK.NS) Bundle
HDFC Bank sits at the apex of Indian private banking with scale, strong capital cushions and diversified earnings that position it to monetize massive cross‑sell opportunities from the HDFC merger and accelerate retail and rural growth-but mounting margin pressure, elevated operating costs from integration, tighter regulatory scrutiny and agile fintech rivals pose clear risks to profitability and share stability, making the bank's next moves on cost synergies, digital AI deployment and liability management pivotal for sustaining its leadership.
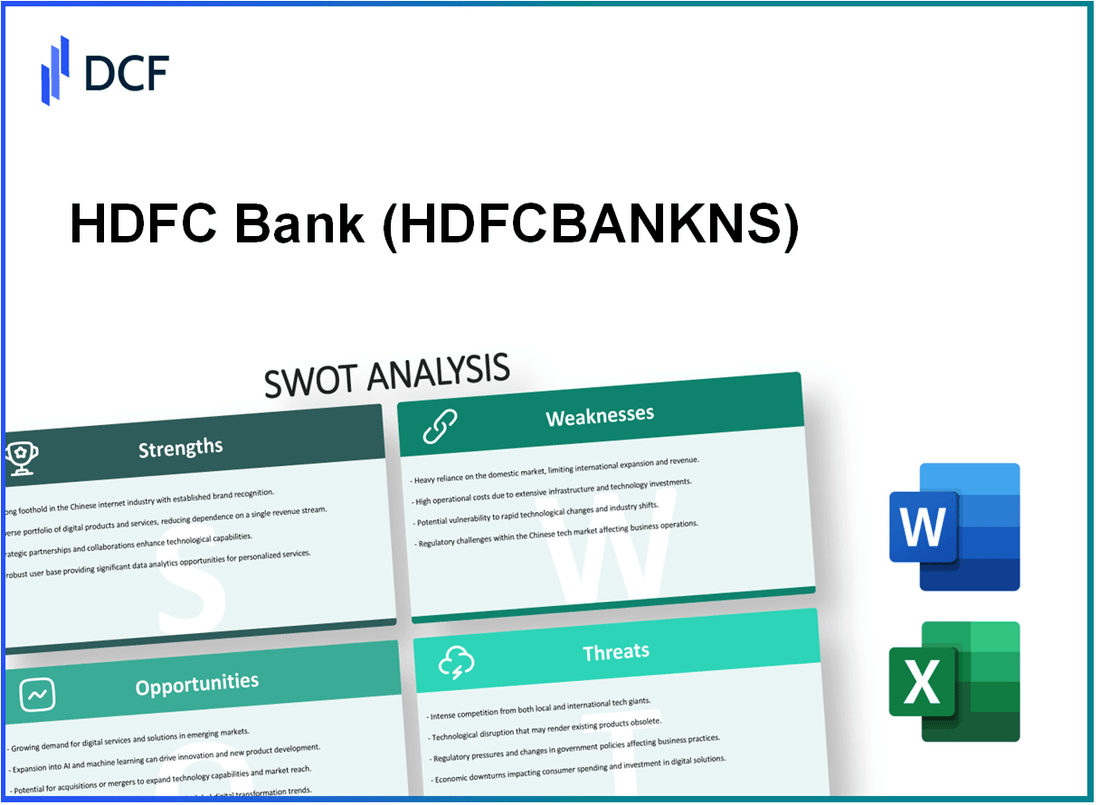
HDFC Bank Limited (HDFCBANK.NS) - SWOT Analysis: Strengths
HDFC Bank's dominant market position and systemic importance underpin its competitive moat. As of December 2025 the bank held approximately 15% market share in total banking sector advances and a 37% share within the private sector banking space. The consolidated balance sheet reached ~₹40.03 lakh crore by September 30, 2025. The bank is one of India's three Domestic Systemically Important Banks (D-SIBs) and maintained a customer base of 99 million by late 2025, up from 96 million a year earlier. Market capitalization stood near ₹15.25 lakh crore in December 2025, placing the bank among the top-ten global banks by valuation.
| Metric | Value (Date) |
| Total balance sheet | ₹40.03 lakh crore (30 Sep 2025) |
| Market share - total advances | ~15% (Dec 2025) |
| Market share - private sector advances | ~37% (Dec 2025) |
| Customer base | 99 million (late 2025) |
| Market capitalization | ~₹15.25 lakh crore (Dec 2025) |
Capital adequacy and risk management metrics provide a robust financial stability profile. As of September 30, 2025, Common Equity Tier 1 (CET1) ratio was 17.5% and total Capital Adequacy Ratio (CAR) was 20.0%, both materially above the regulatory requirement of 11.7%. Asset quality trends improved with Gross NPA at 1.24% in Q2 FY26 (down from 1.4% a year earlier) and Net NPA at 0.4% as of December 2025, reflecting disciplined underwriting and recoveries.
| Capital & Asset Quality Metric | Value (Date) |
| CET1 ratio | 17.5% (30 Sep 2025) |
| Total CAR | 20.0% (30 Sep 2025) |
| Regulatory requirement | 11.7% (benchmark) |
| Gross NPA | 1.24% (Q2 FY26) |
| Gross NPA (prior year) | 1.4% (Q2 FY25) |
| Net NPA | 0.4% (Dec 2025) |
Distribution reach and digital capabilities combine to create a high-convenience omnichannel delivery model. By late 2025 the branch network expanded to 9,545 branches and over 21,000 ATMs across 4,153 cities and towns. Semi-urban and rural coverage now accounts for 51% of the branch network following the addition of 453 branches in H1 FY26. Digitally, 93% of customer transactions are processed via digital channels, supporting operational efficiency and customer engagement. These channels contributed to average deposits growing 15.1% YoY to ₹27.11 lakh crore by September 2025.
| Distribution & Digital | Value (Date) |
| Branches | 9,545 (late 2025) |
| ATMs | >21,000 (late 2025) |
| Cities / towns served | 4,153 (late 2025) |
| Digital transaction share | 93% (H1 FY26) |
| Branches added (H1 FY26) | 453 |
| Semi-urban & rural share of network | 51% (late 2025) |
| Average deposits | ₹27.11 lakh crore (Sep 2025; +15.1% YoY) |
Profitability and revenue diversification remain core strengths. For the quarter ended September 30, 2025 consolidated PAT was ₹19,610 crore, up 10% YoY. Non-interest income grew 25% to ₹14,350 crore during the period, driven by fee and commission income of ₹8,840 crore. Return on assets (RoA) was 1.74% and return on equity (RoE) 14.4% in late 2025, indicating high-quality earnings across retail, wholesale, treasury and fee-based businesses even during post-merger integration.
| Profitability & Revenue | Value (Date) |
| Consolidated PAT (quarter) | ₹19,610 crore (Q2 FY26; +10% YoY) |
| Non-interest income | ₹14,350 crore (Q2 FY26; +25% YoY) |
| Fee & commission income | ₹8,840 crore (Q2 FY26) |
| Return on assets (RoA) | 1.74% (late 2025) |
| Return on equity (RoE) | 14.4% (late 2025) |
Liability management and deposit franchise strength provide funding stability and flexibility. Average deposits grew 15.1% YoY in the quarter ended September 2025, outpacing gross advances growth of 9.9% YoY. The credit-to-deposit ratio improved to 96.5% by December 2025 from ~110% immediately post-merger. CASA deposits rose 8.5% YoY to ₹8.77 lakh crore by end-Q2 FY26, supporting low-cost funding and planned acceleration of loan growth in FY27.
| Liability & Funding Metrics | Value (Date) |
| Average deposit growth | +15.1% YoY (Q2 FY26) |
| Gross advances growth | +9.9% YoY (Q2 FY26) |
| Credit-to-deposit ratio | 96.5% (Dec 2025) |
| Credit-to-deposit post-merger peak | ~110% (immediately after merger) |
| CASA deposits | ₹8.77 lakh crore (end Q2 FY26; +8.5% YoY) |
Key operational and strategic strengths summarized:
- Scale and systemic importance: ~₹40.03 lakh crore balance sheet; 99 million customers; top-tier market cap (~₹15.25 lakh crore).
- Strong capital buffers: CET1 17.5% and Total CAR 20.0% vs regulatory 11.7%.
- Improving asset quality: Gross NPA 1.24% (Q2 FY26); Net NPA 0.4% (Dec 2025).
- Extensive distribution + digital dominance: 9,545 branches; >21,000 ATMs; 93% digital transactions.
- Diversified, high-quality earnings: PAT ₹19,610 crore (Q2 FY26); Non-interest income ₹14,350 crore.
- Robust deposit franchise and liability management: Average deposits ₹27.11 lakh crore; CASA ₹8.77 lakh crore; C/D ratio 96.5%.
HDFC Bank Limited (HDFCBANK.NS) - SWOT Analysis: Weaknesses
Compression in net interest margins due to rising funding costs and asset repricing lags. The core net interest margin (NIM) on total assets moderated to 3.27% in the September 2025 quarter, down from 3.35% in the preceding quarter. This decline reflects a faster repricing of assets compared to deposits amid volatile interest rates in late 2025. Net interest income (NII) rose 4.8% year-on-year to ₹31,550 crore for the quarter, but this growth is slower than the bank's historical averages (five‑year average quarterly NII growth ~8-10%). Management expects continued margin volatility while high-cost liabilities originating from the HDFC merger are replaced by lower-cost retail deposits over the next 12-24 months.
| Metric | Q2 FY2026 (Sep 2025) | Q1 FY2026 (Jun 2025) | YoY / Notes |
|---|---|---|---|
| Net Interest Margin (core, on total assets) | 3.27% | 3.35% | Down 8 bps QoQ |
| Net Interest Income (quarterly) | ₹31,550 crore | ₹30,100 crore | +4.8% YoY |
| Average cost of deposits | ~4.10% (estimated blended) | ~3.95% (estimated) | Upward pressure from term deposit mix |
| Asset repricing lag (est.) | ~2-4 months | - | Leads to temporary margin compression |
Elevated cost-to-income ratio compared to historical pre-merger efficiency levels. The bank's cost-to-income ratio stood at 39.2% for the quarter ended September 30, 2025, as operating expenses rose to ₹17,980 crore. Prior to the merger, the bank frequently delivered sub-35% ratios; the long-term target is 30-35%. Increased spending reflects integration costs, branch additions (453 new branches added in the 12-month period), and sustained technology and compliance investments. Return on assets (RoA) for the quarter moderated to approximately 1.62% (annualized), below the 1.8-2.0% range seen historically at peak efficiency.
- Operating expenses (quarterly): ₹17,980 crore
- Cost-to-income ratio: 39.2% (Q2 FY2026)
- Branches added (12 months): 453
- Target long-term cost-to-income: 30-35%
Recent regulatory penalties and compliance lapses impacting the operational track record. In late 2025, the Reserve Bank of India imposed two penalties on the bank, including a ₹0.91 crore fine in November 2025 for non-compliance with KYC and lending norms. Separately, the Securities and Exchange Board of India (SEBI) issued an administrative warning letter in December 2024 related to merchant banking and insider trading regulation lapses. These regulatory actions necessitated remedial capital-light spend and the strengthening of internal controls, compliance headcount increases, and enhanced monitoring systems-temporarily diverting management bandwidth from commercial initiatives.
| Regulatory Action | Date | Penalty / Action | Primary Issue |
|---|---|---|---|
| RBI penalty | Nov 2025 | ₹0.91 crore | KYC and lending norm non-compliance |
| SEBI administrative warning | Dec 2024 | Warning letter (no monetary penalty disclosed) | Merchant banking / insider trading regulation lapses |
| Corrective measures | Ongoing | Increased compliance spend, process audits | Enhanced risk-management protocols |
Slower growth in the Current Account Savings Account (CASA) ratio impacting the funding mix. CASA declined to 34% by September 2025, versus 35% in the same period a year earlier. Average CASA deposits grew 8.5% year-on-year, but were outpaced by a stronger 18.6% increase in higher-cost time deposits, shifting the deposit mix toward term liabilities. This shift increased the blended cost of funds and exerted upward pressure on lending rates and margins. Sustaining a high CASA ratio is critical to maintain competitive lending spreads versus other private-sector peers.
- CASA ratio: 34% (Sep 2025)
- CASA growth (avg deposits YoY): +8.5%
- Term deposit growth (YoY): +18.6%
- Impact: Higher blended cost of funds, margin pressure
High concentration of institutional ownership potentially leading to stock price volatility. As of December 2025, institutional investors (hedge funds, mutual funds, FIIs) held approximately 84.65% of the bank's total equity. Such concentration can amplify price movements during periods of global risk-off or shifts in foreign portfolio investor sentiment. Delivery volumes for the stock declined by 34.27% in late December 2025, suggesting increased short-term trading or reduced retail participation. The bank must sustain transparency, consistent quarterly metrics, and capital allocation discipline to mitigate the risk of large-scale institutional rebalancing.
| Ownership / Market Metrics | Value |
|---|---|
| Institutional ownership | ~84.65% (Dec 2025) |
| Delivery volume change (late Dec 2025) | -34.27% |
| Retail float (estimated) | ~15-16% |
| Implication | Higher sensitivity to institutional flows and global volatility |
HDFC Bank Limited (HDFCBANK.NS) - SWOT Analysis: Opportunities
Massive cross-selling potential following the full integration of HDFC mortgage customers represents a core growth opportunity. Approximately 70% of the ~40 million former HDFC mortgage customers (≈28 million individuals) did not have a primary banking relationship with HDFC Bank as of December 2025. Management has targeted conversion of this captive customer pool into primary relationships to drive fee income and high-margin product sales.
Key quantified potential from cross-sell:
- Target base: ~28 million convertible customers (70% of 40 million).
- Fee income uplift target: incremental contribution to the bank's fee income which reached ₹8,840 crore in Q2 FY26.
- Product focus: credit cards, personal loans, insurance, wealth products - higher margins relative to secured home loans.
- Time horizon: significant retail market share gains expected over the next 24 months (through end-2027).
Expansion into high-growth rural and semi-urban markets via dedicated branch strategy is another significant opportunity. By late 2025 HDFC Bank had a presence in 165,000 villages and 9,545 branches, with 51% of branches in rural locations. The bank plans to reach 90% of India's districts, focusing on underserved MSME and agricultural segments which reported 17% and 9.9% growth respectively in the most recent quarter.
Rural expansion metrics and targets:
| Metric | Dec 2025 / Most recent | Bank target |
|---|---|---|
| Village presence | 165,000 villages | Increase outreach via BCs & micro-branches across remaining rural clusters |
| Branch network | 9,545 branches; 51% rural | Expand to cover ~90% of districts |
| MSME growth (recent quarter) | 17% | Capture incremental MSME credit demand in Bharat |
| Agriculture growth (recent quarter) | 9.9% | Scale agri-lending and allied services |
Acceleration of loan growth in FY27 as the credit-to-deposit (C/D) ratio stabilizes provides a macro-financial opening. The bank intentionally slowed loan growth in FY25 to manage merger-related balance sheet shifts; by December 2025 the C/D ratio was reduced to 96.5%, freeing liquidity to expand advances.
- Credit-to-deposit ratio: 96.5% (Dec 2025), down from higher merger-era levels.
- Market share of incremental advances: bank aims to exceed the current ~15% share of incremental system growth.
- Projected acceleration: management-guided faster-than-industry advance growth in FY26-FY27 supported by improving economic activity and rate cuts.
- Timeframe: material loan book expansion expected through FY27 with emphasis on retail, MSME and secured corporate.
Digital transformation and AI-driven efficiency gains are positioned to lower long-term operating costs and improve ROE. HDFC Bank's 'Enterprise Factory' initiative is re-architecting core systems and deploying AI for underwriting and process automation. As of 2025, 93% of transactions are digital and the bank serves ~99 million customers.
| Digital / Efficiency Metric | Current (2025) | Target / Impact |
|---|---|---|
| Digital transactions | 93% of all transactions | Maintain >93%; drive product adoption via app |
| Customer base | ~99 million | Increase product penetration per customer |
| Cost-to-income ratio | 39.2% | Target reduction toward ~35%+ via automation |
| Return on Equity (ROE) | Post-merger depressed levels | Restore to 16-18% by late 2026 |
Planned technology outcomes include AI-powered loan approvals to shorten time-to-yes, automated servicing to lower branch workload, and personalized cross-sell flows to raise product-per-customer ratios - all directly improving fee income and lowering unit operating cost.
Strategic capital gains from planned IPOs and stake sales of key subsidiaries represent a non-operating financial opportunity that can fund growth and provide provisions. HDB Financial Services is a primary IPO/stake-sale candidate in 2026-2027; a small stake sale in Q1 FY26 delivered capital gains of ₹910 crore used to bolster floating provisions.
- Recent monetization: ₹910 crore capital gain from a small HDBFS stake sale (Q1 FY26).
- Potential future monetizations: HDBFS IPO, selective stake sales in HDFC Life, HDFC AMC across 2026-2027.
- Use of proceeds: capital cushions, increased provisioning, funding branch & digital expansion without immediate capital raise.
Summary table of opportunity levers with projected near-term financial impact:
| Opportunity Lever | Key Metric | Near-term Financial Impact |
|---|---|---|
| Cross-sell to former HDFC mortgage customers | ~28 million targets; fee income base ₹8,840 crore (Q2 FY26) | Material uplift in fee income; higher NIM through unsecured product mix |
| Rural & semi-urban expansion | 165,000 villages; 51% branches rural; target 90% districts | Incremental loan growth from Bharat; diversification of asset base |
| Loan growth acceleration | C/D ratio 96.5% (Dec 2025); incremental advances share ~15% | Higher advance growth in FY26-FY27; improved interest income |
| Digital & AI transformation | 93% digital transactions; 99 million customers; C/I 39.2% | Lower operating costs; higher ROE (target 16-18% by late 2026) |
| Subsidiary monetization | ₹910 crore realized Q1 FY26; HDBFS/HDFC Life/HDFC AMC candidates | One-off capital gains to fund expansion and provisioning |
HDFC Bank Limited (HDFCBANK.NS) - SWOT Analysis: Threats
Intense competition for low-cost deposits from both public and private sector banks has compressed HDFC Bank's deposit profile. Rival lenders (notably ICICI Bank and Axis Bank) have aggressively repriced deposits to capture retail flows, contributing to a moderation in HDFC Bank's CASA ratio to 34% in late 2025. Industry-wide liquidity stress - deposit growth lagging credit demand - has forced the bank to raise term deposit rates; term deposits grew 14.6% YoY, squeezing net interest margins (NIMs). Failure to attract low-cost CASA at scale would erode the bank's historically superior margin structure.
Heightened regulatory oversight and stricter norms from the Reserve Bank of India increase compliance costs and constrain business flexibility. HDFC Bank faced multiple penalties totalling over ₹1 crore in 2025. New draft RBI guidelines on acquisition financing and tougher provisioning for 'Project Loans' alongside D-SIB capital surcharges subject the bank to higher capital requirements and more frequent operational audits. Prior regulatory actions (e.g., restrictions on new credit card issuance) illustrate the downside: any further lapses could trigger business restrictions or higher capital provisioning, reducing returns on equity.
Potential asset-quality deterioration in unsecured retail and SME portfolios is a material threat. Aggregate Net NPA remains low at 0.4%, but high-growth segments carry concentrated risk: SME loans expanded ~17% YoY and retail loans ~7.4% YoY. Management raised provisions and contingencies to ₹3,500 crore in Q2 FY26 (up 29.6% YoY) to buffer expected stress. Adverse macro scenarios - persistent inflation, rate shocks, supply-chain disruptions or localized SME distress - could elevate credit costs rapidly and impair profitability and capital ratios.
Global macroeconomic volatility can depress foreign portfolio investment and the bank's stock valuation. Institutional ownership stands at ~84.65%, making HDFC Bank highly sensitive to global risk-on/risk-off flows and interest-rate moves. In late 2025, foreign institutional investors were net sellers in Indian derivatives, keeping the stock in a narrow trading range. A downturn in US/Europe or widening emerging-market stress could trigger capital flight, hindering the bank's ability to raise equity at attractive valuations if required for growth or regulatory buffers.
Disruptive competition from FinTechs and the Digital Rupee rollout threatens fee income and deposit franchises. FinTechs are gaining share in payments, wealth management and small-ticket lending by delivering superior UX and lower-cost origination. The gradual rollout of the Central Bank Digital Currency (Digital Rupee or CBDC) could, over time, disintermediate traditional deposit-taking and payment margins. HDFC Bank's digital transactions share is ~93%, but maintaining that lead requires continuous and potentially expensive investment; smaller agile competitors can force higher tech spend and compress high-margin retail fee income.
| Threat | Key Metrics / Evidence | Potential Impact | Probability (Near-term) |
|---|---|---|---|
| Deposit competition & CASA erosion | CASA 34% (late 2025); term deposits +14.6% YoY; industry liquidity tight | NIM compression, higher funding cost | High |
| Regulatory tightening | Penalties >₹1 crore (2025); D-SIB surcharges; new project loan rules | Higher capital/provision needs; operational constraints | High |
| Asset-quality stress in SME/retail | Net NPA 0.4%; SME loans +17% YoY; retail loans +7.4% YoY; provisions ₹3,500 Cr (Q2 FY26) | Rising credit costs; profit and capital pressure | Medium-High |
| Global macro volatility / FPI outflows | Institutional ownership ~84.65%; FI net sellers in derivatives (late 2025) | Stock volatility; constrained equity-raising | Medium |
| FinTech disruption & Digital Rupee | Digital transactions share ~93%; proliferation of nimble FinTechs; CBDC rollout | Loss of fee income, higher tech spend, deposit disintermediation | Medium |
- Rate/Risk Sensitivity: Higher market rates and deposit repricing directly reduce NIMs (observed term-deposit growth +14.6% YoY vs CASA moderation to 34%).
- Provisioning Shock: Provisions increased to ₹3,500 crore in Q2 FY26 (+29.6% YoY) indicate preparedness but also underline vulnerability to a worse credit-cycle scenario.
- Regulatory Cost: D-SIB surcharges and more frequent audits increase CET1 and leverage buffer requirements, constraining return on equity and lending capacity.
- Market Vulnerability: With ~84.65% institutional holding, equity valuation and implied cost of capital are exposed to global liquidity swings and emerging-market risk premia.
- Technology Arms Race: Maintaining a ~93% digital transaction share requires sustained capex/OPEX on platforms, cybersecurity and partnerships versus lower-cost FinTech rivals.
Disclaimer
All information, articles, and product details provided on this website are for general informational and educational purposes only. We do not claim any ownership over, nor do we intend to infringe upon, any trademarks, copyrights, logos, brand names, or other intellectual property mentioned or depicted on this site. Such intellectual property remains the property of its respective owners, and any references here are made solely for identification or informational purposes, without implying any affiliation, endorsement, or partnership.
We make no representations or warranties, express or implied, regarding the accuracy, completeness, or suitability of any content or products presented. Nothing on this website should be construed as legal, tax, investment, financial, medical, or other professional advice. In addition, no part of this site—including articles or product references—constitutes a solicitation, recommendation, endorsement, advertisement, or offer to buy or sell any securities, franchises, or other financial instruments, particularly in jurisdictions where such activity would be unlawful.
All content is of a general nature and may not address the specific circumstances of any individual or entity. It is not a substitute for professional advice or services. Any actions you take based on the information provided here are strictly at your own risk. You accept full responsibility for any decisions or outcomes arising from your use of this website and agree to release us from any liability in connection with your use of, or reliance upon, the content or products found herein.