
|
SITE Centers Corp. (SITC): ANSOFF MATRIX [Dec-2025 Updated] |
Fully Editable: Tailor To Your Needs In Excel Or Sheets
Professional Design: Trusted, Industry-Standard Templates
Investor-Approved Valuation Models
MAC/PC Compatible, Fully Unlocked
No Expertise Is Needed; Easy To Follow
SITE Centers Corp. (SITC) Bundle
You've seen SITE Centers Corp. (SITC) make big moves this year, returning capital with aggregate special dividends of $5.75 per share in 2025 alone, all while trimming debt down to about $0.3 billion. Now that the cleanup is done and they've realized $380.9 million from asset sales, the real question is where the growth comes from next for their high-quality, open-air centers, especially when they still have 33 properties needing tactical redevelopment. Honestly, figuring out the next chapter after such a strategic reset can be tough, so I've mapped out exactly what they can do-from aggressively leasing that remaining 12.4% vacancy to exploring entirely new sectors-using the Ansoff Matrix below to give you clear, actionable paths forward.
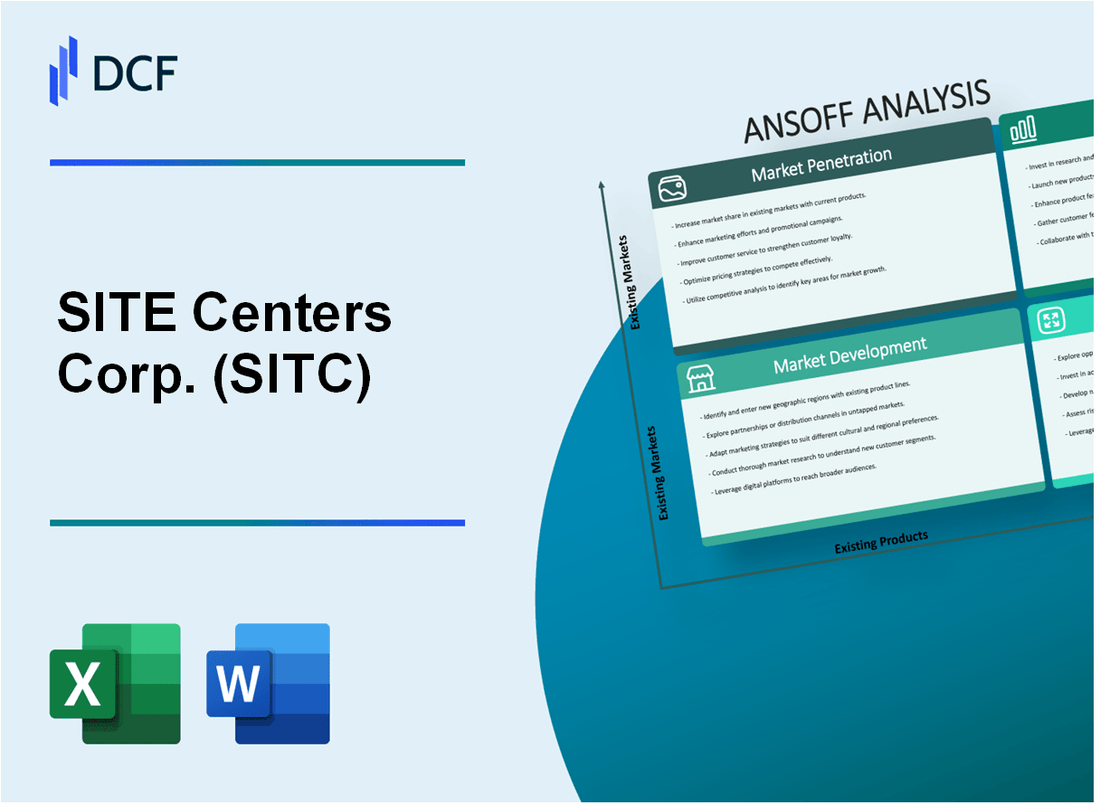
SITE Centers Corp. (SITC) - Ansoff Matrix: Market Penetration
The immediate focus for Market Penetration is closing the gap on current occupancy levels using existing assets.
The leased rate for SITE Centers Corp. stood at 87.6% as of September 30, 2025, meaning the portfolio currently carries a 12.4% vacancy rate, which aligns directly with the target to aggressively lease the remaining space to achieve a 90%+ leased rate.
The commenced rate, which reflects leases that have actually begun, was lower at 86.5% on September 30, 2025, indicating a lag between signing and revenue recognition for some of the leased space.
For the third quarter of 2025, leasing activity included executing six new leases and 23 renewals, totaling 237,000 square feet.
The current base rent per square foot (PSF) across the portfolio was reported at $19.62 as of the third quarter end.
To drive rental rate growth, the most recent available leasing spread data from Q1 2025 showed new leases running at 6.8% and renewals at 3.4%.
The following table summarizes key operating metrics relevant to maximizing current market penetration efforts:
| Metric | Value (Q3 2025) | Contextual Data Point |
| Leased Rate | 87.6% | Targeting 90%+ |
| Commenced Rate | 86.5% | Reflects transactional activity |
| Base Rent PSF | $19.62 | Current average rental rate |
| New Lease Spreads (Q1 2025) | 6.8% | Indicates pricing power on new deals |
| Renewal Spreads (Q1 2025) | 3.4% | Indicates pricing power on existing tenants |
Driving shopper dwell time through small-scale common area upgrades is a strategy supported by the overall focus on maximizing asset value, though specific capital expenditure amounts for this purpose in 2025 are not detailed in the latest operating summaries.
Optimizing the tenant mix by replacing lower-performing retailers with essential, high-traffic anchors is an ongoing asset management function; year-to-date through Q3 2025, SITE Centers Corp. had sold seven properties for an aggregate price of $380.9 million, which inherently refines the portfolio mix.
Furthermore, as of the Q3 2025 report, the company had in excess of $292 million of additional properties under contract for sale, which will continue to reshape the portfolio composition.
Data on the volume or success of offering short-term pop-up leases to local businesses to test new concepts is not explicitly quantified in the recent operating results.
Finance: draft 13-week cash view by Friday.
SITE Centers Corp. (SITC) - Ansoff Matrix: Market Development
Market development for SITE Centers Corp. (SITC) centers on expanding the existing open-air retail model into new geographic territories, supported by a significantly de-leveraged balance sheet.
Leverage Reduced Debt Load to Fund New Market Entry Acquisitions
You're looking at a company that has aggressively managed its capital structure, freeing up resources for expansion. SITE Centers Corp. (SITC) successfully cut its weighted average debt outstanding from $1.6 billion in Q1 2024 down to $0.3 billion in Q1 2025. This reduction, achieved through substantial asset sales, provides the financial flexibility to fund acquisitions in new, high-growth suburban markets.
The company's recent asset disposition activity has generated significant cash proceeds, which have been strategically applied to debt reduction, setting the stage for new market entry.
- Weighted average debt outstanding reduced by 81.3% between Q1 2024 and Q1 2025.
- The weighted average interest rate on the remaining debt floated 200 bps higher than a year prior, settling at 6.5% as of Q1 2025.
- The remaining debt consists of two mortgages with a weighted average maturity of 2.1 years.
Acquire Premier Grocery-Anchored Centers in New, High-Growth Sun Belt Suburban Markets
SITE Centers Corp. (SITC) has historically concentrated assets in the Sun Belt and Southeast regions. The current portfolio size, as of Q3 2025, stands at 27 shopping centers and two office buildings. The strategy involves targeting similar high-growth suburban areas, leveraging the established success of the grocery-anchored model in those demographics.
Recent sales activity, while primarily focused on portfolio refinement, generated capital that can now be redeployed into new markets. The leasing metrics provide context for the model's current performance:
- Average annualized base rent per square foot across the portfolio was $19.62 as of September 30, 2025.
- Occupancy rate stood at 86.7% at September 30, 2025.
- The leased rate decreased to 87.6% from 91.1% at the end of 2024, reflecting transactional activity.
Form Joint Ventures and Target Expansion into Select High-Barrier-to-Entry Coastal Markets
Expansion outside the current core involves forming joint ventures with regional developers to enter high-wage metropolitan areas and targeting high-barrier coastal markets. The company already maintains interests in 11 joint venture properties, which contributed $299 thousand in net income for Q1 2025.
The company has recently executed sales of properties in markets like Orlando, FL, and Phoenix, AZ, generating capital for potential new market entries. The following table details recent asset sales and associated debt repayments:
| Property/Portfolio Sold | Aggregate Price (USD) | Mortgage Debt Repaid (USD) | Closing/Announcement Quarter |
| Winter Garden Village (Orlando, FL) and Deer Valley Towne Center (Phoenix, AZ) | $198.7 million (165.0M + 33.7M) | $22.3 million | Q3 2025 |
| East Hanover Plaza, Southmont Plaza, and Stow Community Center | $126.0 million | $38.2 million | Q4 2025 expected |
| Parker Pavilions (Parker, CO) | Approximately $8.4 million | Approximately $6.1 million | Reported in 2025 |
| Edgewater Towne Center (Edgewater, NJ) | $53.5 million | Not applicable (no mortgage debt repayment) | Reported in 2025 |
| Four shopping centers (aggregate) | Approximately $263.6 million | Utilized $38.2 million from proceeds | Since October 2023 |
Market the Existing Open-Air Retail Model to Institutional Investors in New Regions
SITE Centers Corp. (SITC) is marketing its core open-air retail model to institutional capital sources in new geographic areas. The company announced a special cash distribution of $1.00 per common share on October 21, 2025, payable on November 14, 2025, following other significant distributions in 2025. The company reported total special cash dividends of $250.3 million in the nine months ending September 30, 2025.
The company's Q3 2025 results showed a net loss attributable to common shareholders of $6.2 million, or $0.13 per diluted share. Operating Funds From Operations (OFFO) decreased to $5.6 million, or $0.11 per diluted share, down from $42.8 million, or $0.81 per diluted share, in the prior year period. Still, the focus remains on maximizing asset value through leasing and sales to attract external capital interest.
SITE Centers Corp. (SITC) - Ansoff Matrix: Product Development
You're looking at how SITE Centers Corp. (SITC) is actively managing and enhancing its existing asset base, which falls under the Product Development quadrant when considering improvements to the current property offering. The strategy, as of late 2025, appears heavily weighted toward monetization, but the execution of leasing and asset management on the remaining portfolio still represents a form of product enhancement.
Execute tactical redevelopment initiatives on the remaining properties. As of December 4, 2025, SITE Centers Corp. owns 11 wholly-owned properties and holds interests in 11 joint venture properties, following asset sales totaling $3.7 billion since October 2023. The company is in contract negotiations for the sale of four wholly-owned properties and one joint venture interest. The overall leased rate for the operating shopping center portfolio stood at 87.6% on a pro rata basis as of September 30, 2025.
The execution of leasing activity shows the ongoing effort to improve the tenant mix within the existing footprint. For the second quarter of 2025, SITE Centers Corp. executed new leases and renewals totaling 145,000 square feet. The leased rate as of June 30, 2025, was 88.1%.
Introduce non-traditional tenants like medical clinics or co-working spaces into former big-box spaces. While specific data on new non-traditional tenant categories in former big-box spaces isn't explicitly detailed with 2025 financial figures, the overall strategy is reflected in the financial results from property sales and distributions. For instance, the company paid special cash distributions of $1.50 per common share on July 15, 2025, and $3.25 per common share on August 29, 2025. Another special cash distribution of $1.00 per common share was announced for December 30, 2025. Year to date through September 30, 2025, aggregate dividends declared totaled $5.75 per share.
Invest in digital infrastructure (e.g., smart parking, free Wi-Fi) to enhance the customer experience. The company is focused on asset disposition, but its balance sheet management reflects capital allocation decisions. SITE Centers Corp. plans to use approximately $84.1 million in cash to fully repay its mortgage facility with affiliates of Atlas SP Partners, L.P. and Athene Annuity and Life Company. The company's debt-to-equity ratio is 0.81.
Convert underutilized parking areas into higher-value uses like drive-thru lanes or small pad sites. The company recorded impairments of $106.6 million in the third quarter of 2025 due to changes in hold period assumptions for five wholly-owned assets. Year to date, SITE Centers Corp. sold seven properties for an aggregate price of $380.9 million. Furthermore, as of November 5, 2025, there were in excess of $292 million of properties under contract for sale.
Explore adding residential or mixed-use components to select centers for defintely higher density. The financial results for the third quarter ended September 30, 2025, showed a net loss attributable to common shareholders of $6.2 million, or $0.13 per diluted share, compared to a net income of $320.2 million, or $6.07 per diluted share, in the year-ago period. Operating Funds from Operations (OFFO) attributable to common shareholders for Q3 2025 was $5.6 million, or $0.11 per diluted share. The trailing twelve-month revenue as of September 30, 2025, was $138,093 thousand.
Here's a quick look at recent asset disposition and leasing metrics:
| Metric | Value | Date/Period |
| Total Asset Sales Since Oct 2023 | $3.7 billion | As of Dec 2025 |
| Properties Sold Year to Date | 7 | As of Sep 30, 2025 |
| Aggregate Sale Proceeds YTD | $380.9 million | As of Sep 30, 2025 |
| Properties Under Contract for Sale (Value) | > $292 million | As of Nov 5, 2025 |
| Q2 2025 New Leases/Renewals | 145,000 square feet | Q2 2025 |
| Leased Rate (Pro Rata) | 87.6% | Sep 30, 2025 |
| Debt-to-Equity Ratio | 0.81 | As of late 2025 |
The company's stock price as of October 31, 2025, was $7.33, with a market capitalization of $384M based on 52.5M shares.
SITE Centers Corp. (SITC) - Ansoff Matrix: Diversification
You're looking at how SITE Centers Corp. (SITC) is using capital recycling to fund moves outside its core open-air retail focus. This is the diversification quadrant of the Ansoff Matrix, moving into new product/service areas in new markets.
Here are some key financial snapshots from the 2025 reporting period to frame this strategic shift:
| Metric | Value |
| YTD 2025 Asset Sales Proceeds | $380.9 million |
| Properties Under Contract for Sale (Additional) | Over $292 million |
| Total Revenue (Nine Months Ended Sept. 30, 2025) | $103.2 million |
| Q3 2025 Revenue | $24.528 million |
| Leased Rate (As of September 30, 2025) | 87.6% |
| Q3 2025 Net Loss Attributable to Common Shareholders | $6.2 million |
| Aggregate Dividends Declared YTD 2025 (Including Specials) | $5.75 per share |
The capital generated from asset disposition is the engine for these new sector entries. The sale of seven properties for an aggregate of $380.9 million year-to-date in 2025 provides the dry powder for measured, non-retail real estate investment.
The diversification playbook for SITE Centers Corp. (SITC) involves several distinct, non-retail-centric initiatives:
- Acquire small portfolios of industrial assets, leveraging the REIT structure in a new sector.
- Establish a dedicated fund to invest in single-tenant net lease properties, a lower-management asset class.
- Partner with a residential developer to build multi-family units on excess land at existing sites.
- Utilize the capital from $380.9 million in 2025 asset sales for a measured entry into non-retail real estate.
- Develop a property management service line for third-party open-air centers, creating a fee-based revenue stream.
The move to acquire small portfolios of industrial assets is a direct attempt to diversify the sector exposure away from retail, using the existing REIT structure's tax and capital advantages in a new asset class. This is supported by the capital recycling efforts, as evidenced by the $380.9 million in asset sales year-to-date in 2025.
Establishing a dedicated fund for single-tenant net lease properties targets a lower-management intensity asset class. This contrasts with the active management required for the core grocery-anchored centers, which still showed a leased rate of 87.6% as of September 30, 2025, despite the ongoing transactional activity.
Partnerships for multi-family development on excess land at existing sites monetizes underutilized real estate value. This strategy is funded by the proceeds from dispositions, such as the $380.9 million generated from seven property sales through the first nine months of 2025.
The capital from $380.9 million in 2025 asset sales is explicitly earmarked for a measured entry into non-retail real estate. This is happening while the company is also returning capital, having declared aggregate dividends of $5.75 per share year-to-date in 2025.
Developing a property management service line for third-party open-air centers creates a fee-based revenue stream. This leverages SITE Centers Corp. (SITC)'s core competency in managing open-air centers, a skill set that supported a trailing 12-month revenue of $52.14 million ending September 30, 2025, even as the portfolio shrinks.
Finance: draft 13-week cash view by Friday.
Disclaimer
All information, articles, and product details provided on this website are for general informational and educational purposes only. We do not claim any ownership over, nor do we intend to infringe upon, any trademarks, copyrights, logos, brand names, or other intellectual property mentioned or depicted on this site. Such intellectual property remains the property of its respective owners, and any references here are made solely for identification or informational purposes, without implying any affiliation, endorsement, or partnership.
We make no representations or warranties, express or implied, regarding the accuracy, completeness, or suitability of any content or products presented. Nothing on this website should be construed as legal, tax, investment, financial, medical, or other professional advice. In addition, no part of this site—including articles or product references—constitutes a solicitation, recommendation, endorsement, advertisement, or offer to buy or sell any securities, franchises, or other financial instruments, particularly in jurisdictions where such activity would be unlawful.
All content is of a general nature and may not address the specific circumstances of any individual or entity. It is not a substitute for professional advice or services. Any actions you take based on the information provided here are strictly at your own risk. You accept full responsibility for any decisions or outcomes arising from your use of this website and agree to release us from any liability in connection with your use of, or reliance upon, the content or products found herein.