
|
Monarch Casino & Resort, Inc. (MCRI): BCG Matrix [Dec-2025 Updated] |
Fully Editable: Tailor To Your Needs In Excel Or Sheets
Professional Design: Trusted, Industry-Standard Templates
Investor-Approved Valuation Models
MAC/PC Compatible, Fully Unlocked
No Expertise Is Needed; Easy To Follow
Monarch Casino & Resort, Inc. (MCRI) Bundle
You're looking for the straight scoop on Monarch Casino & Resort, Inc.'s portfolio health as of late 2025, and honestly, the picture is one of a well-managed regional operator balancing a clear growth driver with a reliable cash engine. The Black Hawk operation is definitely the Star, showing a 5.0% casino revenue jump in Q3, while the Reno asset acts as the dependable Cash Cow, underpinning a $0.30 quarterly dividend and boasting $107.6 million in cash. Still, we need to watch the dip in Food & Beverage volume, which looks like a Dog, and keep a close eye on that $74.6 million litigation judgment hanging over the Question Marks section. Dive in to see exactly where Monarch Casino & Resort, Inc.'s near-term focus should be.
Background of Monarch Casino & Resort, Inc. (MCRI)
You're looking at the current state of Monarch Casino & Resort, Inc. (MCRI), a company that owns and operates two primary luxury casino resort properties. Founded in 1993, Monarch Casino & Resort, Inc. is headquartered in Reno, Nevada, and is led by Co-Chairman and Chief Executive Officer, John Farahi. The company generates the bulk of its revenue from its casino operations, supported by food and beverage, and hotel services.
Monarch Casino & Resort, Inc. focuses on two key assets in the regional gaming markets. First is the Atlantis Casino Resort Spa in Reno, Nevada, which features 817 guest rooms and suites alongside approximately 61,000 square feet of casino space. Second is the Monarch Casino Resort Spa Black Hawk in Black Hawk, Colorado, which offers 516 guest rooms and suites and about 60,000 square feet of gaming area.
The company just wrapped up its third quarter of 2025, reporting what management called all-time record quarterly financial results. For the three months ended September 30, 2025, Monarch Casino & Resort, Inc. posted net revenue of $142.8 million, which was a 3.6% increase year-over-year.
Profitability metrics showed strong operational discipline, with the third quarter of 2025 Adjusted Earnings Before Interest, Taxes, Depreciation, and Amortization (EBITDA) hitting an all-time quarterly record of $54.8 million. This translated to an Adjusted EBITDA margin of 38.4% for the quarter, an expansion of approximately 170 basis points from the prior year period.
Looking at the balance sheet as of September 30, 2025, Monarch Casino & Resort, Inc. maintained a strong liquidity position. The company reported cash and cash equivalents totaling $107.6 million and, importantly, had no borrowings against its credit facility.
Reflecting this performance, the Board declared a cash dividend of $0.30 per share, payable in December 2025. For the trailing twelve months ending September 30, 2025, the consolidated net revenue for Monarch Casino & Resort, Inc. stood at approximately $540 million.
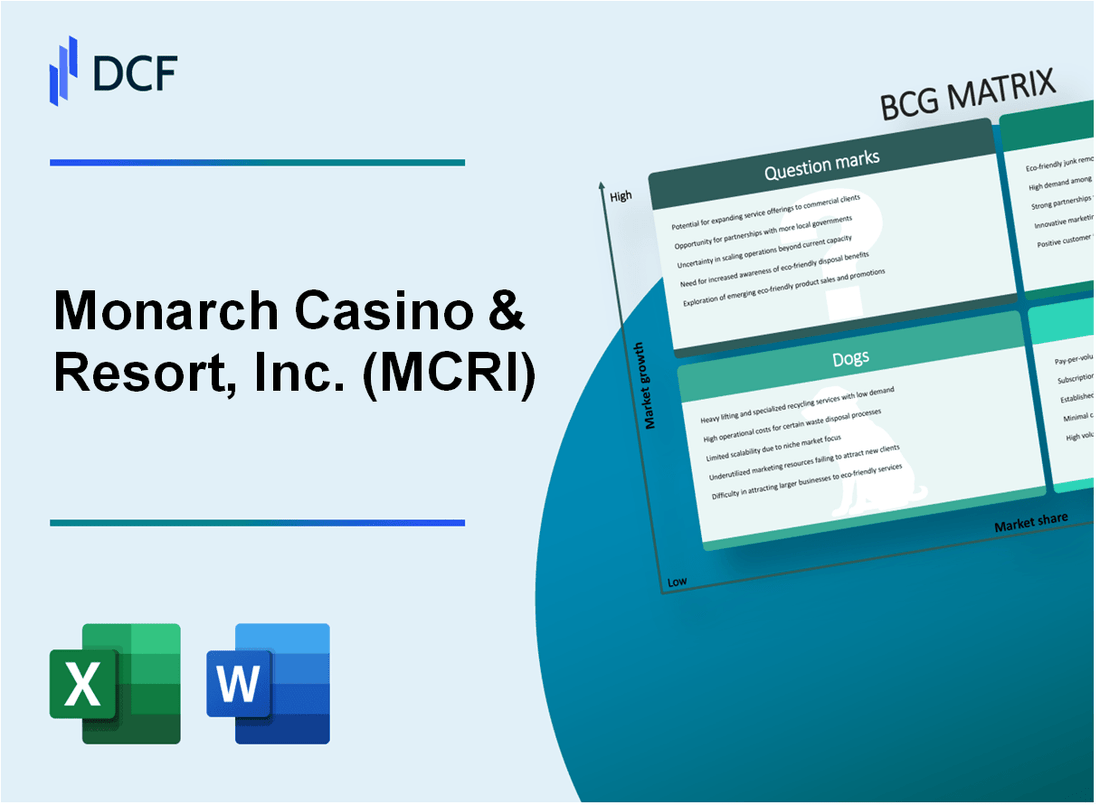
Monarch Casino & Resort, Inc. (MCRI) - BCG Matrix: Stars
The Monarch Casino Resort Spa Black Hawk, Colorado operations clearly fit the Star quadrant profile. This business unit operates in what is characterized as a premier luxury position within a high-growth Denver-area gaming market. The strategy here is clearly focused on capturing and maintaining leadership in a growing segment.
The performance in the third quarter of 2025 demonstrates this high-growth, high-share dynamic. The Black Hawk property is specifically credited with driving market share gains, which contributed significantly to the overall company performance. The casino segment, the cornerstone of this operation, saw its gambling win rise by 5.0% year-on-year for the quarter ending September 30, 2025. This growth is directly attributed to its luxury positioning attracting mid-to-upper-tier guests from the Denver and Boulder metro areas.
To maintain this dominance in a high-growth market, continued capital investment is necessary, even while the property is already established. The company's overall capital expenditures (Capex) in Q3 2025 totaled $5.4 million, which covered ongoing maintenance capital expenditures at both properties, showing a commitment to keeping the asset fresh. The strong financial position, with $107.6 million in cash and no debt as of September 30, 2025, provides the necessary fuel for these investments, which are crucial to prevent the Star from fading.
Here are some key operational and financial metrics supporting the Star classification for Monarch Casino Resort Spa Black Hawk:
| Metric | Value / Rate (Q3 2025) | Context |
| Casino Revenue Growth (YoY) | 5.0% | Directly cited casino win increase. |
| Property Guest Rooms | 516 | Physical capacity of the Black Hawk resort. |
| Casino Square Footage | 60,000 square feet | Size of the gaming floor. |
| Market Position | Premier luxury casino resort | Self-described positioning in Colorado. |
| Q3 2025 Capital Expenditures | $5.4 million | Total Capex for the quarter, funding maintenance. |
| Cash on Hand (End of Q3 2025) | $107.6 million | Financial strength supporting investment. |
The Star designation implies that Monarch Casino & Resort, Inc. must continue to invest heavily to defend its market share gains. If the high-growth market slows, this unit is poised to transition into a Cash Cow, generating significant free cash flow without the same level of reinvestment pressure. The management is definitely aware of this dynamic.
The operational focus supporting the Star status includes:
- Attracting mid-to-upper-tier guests from the Denver and Boulder metro areas.
- Sustaining market share gains through luxury positioning.
- Generating record quarterly Adjusted EBITDA of $54.8 million for the company in Q3 2025.
- Maintaining a strong balance sheet with no outstanding debt.
- Returning capital to stockholders via a $0.30 per share dividend announced for December 15, 2025.
The company reported total net revenue of $142.8 million for the third quarter of 2025, with net income rising 14.4% to $31.6 million. The ability to fund capital expenditures and a $0.30 per share dividend entirely from operating cash flow, while holding over $107 million in cash, underpins the strategy to feed this Star. The number of shares outstanding as of October 23, 2025, was 18,250,291.
Monarch Casino & Resort, Inc. (MCRI) - BCG Matrix: Cash Cows
You're looking at the core engine of Monarch Casino & Resort, Inc. (MCRI) operations, the asset that funds the rest of the portfolio. In the BCG framework, this is where high market share meets low growth-a mature, dominant position that prints cash. For MCRI, this role is clearly held by the Atlantis Casino Resort Spa in Reno, Nevada.
Atlantis functions as a stable, mature market leader. Its consistent performance generates significant, reliable cash flow, which directly supports shareholder returns. This asset's strength is evident in the company's ability to maintain a substantial shareholder payout, specifically the $0.30 per share quarterly dividend. You see this stability reflected in the balance sheet as of September 30, 2025, where Monarch held $107.6 million in cash and cash equivalents and, importantly, carried no borrowings against its credit facility.
The profitability profile of this unit is defintely high-margin, as demonstrated by the latest reported figures. Consider the operational performance through the third quarter of 2025:
- Achieved an all-time quarterly record Adjusted EBITDA of $54,848 thousand.
- Reported an Adjusted EBITDA margin of 38.4% for Q3 2025.
- Generated $147,268 thousand in Adjusted EBITDA for the nine months ended September 30, 2025.
- Maintained a strong liquidity position with $107.6 million in cash on hand.
The dominance of the Reno asset is supported by its market standing. It's consistently ranked the #1 Reno resort on TripAdvisor and was ranked the #1 hotel in Reno by US News & World Report in 2025, placing it in the top 25% of all hotels in the destination area. Furthermore, Atlantis is the only property in Reno recognized by Forbes Travel Guide, with its Steakhouse and Spa both earning prestigious Four-Star Awards.
Cash cows are where you invest just enough to maintain productivity, milking the gains passively. For Monarch Casino & Resort, Inc., this means supporting infrastructure to keep Atlantis running smoothly, like the recent capital expenditures for room redesigns, rather than aggressive growth spending. Here's a quick look at the key financial metrics demonstrating this cash-generating power as of the end of Q3 2025:
| Metric | Value (as of Sep 30, 2025) |
| Q3 2025 Net Revenue | $142,814 thousand |
| Q3 2025 Adjusted EBITDA | $54,848 thousand |
| Nine Months Ended Sep 30, 2025 Adjusted EBITDA | $147,268 thousand |
| Cash and Cash Equivalents | $107.6 million |
| Credit Facility Borrowings | $0 |
| Quarterly Cash Dividend Declared | $0.30 per share |
This unit provides the necessary capital to cover corporate overhead, service any debt, and fund the high-risk, high-growth Question Marks in the portfolio. The high market share in a mature market allows Monarch Casino & Resort, Inc. to achieve these strong margins without needing heavy promotional spending.
Monarch Casino & Resort, Inc. (MCRI) - BCG Matrix: Dogs
Dogs, in the Monarch Casino & Resort, Inc. (MCRI) portfolio context, represent business units characterized by low market share in markets with limited growth prospects. These units often consume managerial attention without delivering substantial returns, making divestiture or aggressive cost management the typical strategic response.
The Food & Beverage (F&B) segment, while showing revenue growth in the most recent quarter, exhibits characteristics that could place it in this quadrant depending on underlying volume and market share dynamics. In the third quarter of 2025, F&B revenue was reported at $33.84 million, marking a 2.9% increase year-over-year. This revenue increase occurred alongside a significant improvement in operational efficiency, with F&B operating expense as a percentage of F&B revenue decreasing to 69.9% from 72.8% in the third quarter of 2024. This margin improvement suggests successful cost control, potentially masking underlying low volume growth, which aligns with the Dog profile if market share is stagnant.
Here is a look at the recent F&B segment performance metrics:
| Metric | Q1 2025 | Q2 2025 | Q3 2025 |
| Revenue Change (YoY) | -0.5% | +1.1% | +2.9% |
| F&B Operating Expense Ratio | 74.3% | 70.3% | 69.9% |
The volatility, such as the 0.5% revenue decline in the first quarter of 2025, suggests sensitivity to external factors or a lack of consistent market penetration.
The clearest candidate for a Dog classification, based on recent performance trends, is the Other revenue segment. This segment experienced a substantial year-over-year decline of 9.8% in the third quarter of 2025, falling to $6.35 million. A segment showing a near double-digit revenue contraction in a period of overall company growth strongly suggests low market share in a declining or mature niche, fitting the Dog description perfectly.
The narrative around non-optimized back-of-house operations is supported by the historical expense ratios that management has actively targeted for reduction. For instance, the F&B expense ratio was 72.8% in Q3 2024 and 74.8% in Q1 2025. The focus on streamlining processes and utilizing technology has driven these ratios down, indicating that prior operations were indeed less optimized, which is a common characteristic of underperforming units that are now candidates for turn-around efforts or divestiture if improvements fail to materialize.
The strategic implications for these units involve minimizing cash consumption. The company's actions suggest a move toward optimization rather than immediate abandonment, but the low-growth nature persists:
- Other Segment Revenue Decline (Q3 2025): 9.8% decrease to $6.35 million.
- F&B Expense Ratio Improvement (Q3 2025): Fell to 69.9% from 72.8% year-over-year.
- Prior F&B Expense Ratio (Q1 2025): Stood at 74.3%.
- SG&A as % of Net Revenue (Q3 2025): Decreased to 19.3% from 19.7% year-over-year.
Expensive turn-around plans are generally avoided for Dogs, but Monarch Casino & Resort, Inc. (MCRI) is clearly investing in efficiency, as seen by the capital expenditure of $5.4 million in Q3 2025, allocated to room redesigns and ongoing maintenance projects.
Monarch Casino & Resort, Inc. (MCRI) - BCG Matrix: Question Marks
You're looking at the assets that are burning cash now but hold the promise of future dominance-the Question Marks. For Monarch Casino & Resort, Inc. (MCRI), this quadrant is heavily influenced by the recent capital deployment at Atlantis in Reno and significant legal overhang.
The Non-Gaming Luxury Amenities at Atlantis Post-Renovation
The non-gaming luxury amenities at Atlantis are positioned as high-growth potential areas within the Reno resort, but their market share capture is still in the early stages, making them classic Question Marks. While the company is committed to the 'ongoing enhancement of the property,' the immediate results show a mixed picture against a 'highly competitive' Reno market. The focus remains on driving 'increased guest visitation and sustained revenue growth' from this elevated product.
Here's a look at the hotel segment performance as of the third quarter of 2025:
| Metric | Q3 2025 Value | Comparison/Context |
|---|---|---|
| Hotel Revenue Growth (YoY) | 3.9% | Solid growth, but the market is competitive. |
| Capital Expenditure (Q3 2025) | $5.4 million | Mainly allocated to completed Atlantis room redesign. |
| Hotel Operating Expense (% of Revenue) | 31.4% | Down from 33.8% in Q3 2024, showing improved efficiency. |
$100 Million Atlantis Upgrade is Complete, But the Full Return is Still Developing
The near $100 million capital investment in the redesign and upgrade of the hotel rooms at Atlantis is now largely complete. The company indicated in Q1 2025 that the remaining 76 hotel rooms were anticipated to be finished before Memorial Day weekend. This massive outlay is designed to elevate the product and capture a higher share of the non-gaming spend. However, the full financial payoff-the transition from Question Mark to Star-is not yet realized, as evidenced by the moderate 3.9% hotel revenue gain in Q3 2025, which was supported by higher room rates rather than a massive volume surge.
The company's cash position, ending Q3 2025 with $107.6 million in cash and no debt, provides the necessary cushion to support this investment while it matures. Still, this cash is a finite resource that must be managed against other capital needs.
Hotel Revenue Growth of 3.9% in Q3 2025 is Solid, But the Reno Market Remains Highly Competitive
The 3.9% increase in hotel revenue for the third quarter of 2025 is a positive indicator of the renovation's initial impact, especially when compared to the 0.5% decrease in Food & Beverage revenue in Q1 2025. Still, the narrative consistently points to Monarch Black Hawk as the primary driver of market share gains and overall growth, suggesting Atlantis is fighting harder for its share in the Reno segment. The competitive nature of the Reno market means that achieving the high growth rate necessary to move this segment out of the Question Mark quadrant requires sustained, aggressive marketing and service excellence.
Key takeaways on growth drivers:
- Monarch Black Hawk continues to gain market share, especially from Denver and Boulder.
- Atlantis is focused on delivering a 'fresh high-quality product.'
- Casino revenue growth was 5.0% in Q3 2025, outpacing hotel revenue growth.
The $74.6 Million PCL Construction Litigation Judgment is a Major Near-Term Capital Risk
The net judgment of $74,627,657 awarded to PCL Construction in February 2025 represents a significant drain on potential capital, fitting the Question Mark characteristic of consuming cash without immediate return. Although Monarch Casino & Resort, Inc. intends to appeal the decision to the Colorado Court of Appeals, the liability exists and required an adjustment to the 2024 financial results. This legal uncertainty and potential cash outflow act as a major constraint, preventing heavy investment in other potential Question Marks or accelerating the path for existing ones.
The key financial risk points are:
- Net judgment against Monarch: $74,627,657.
- Monarch's counterclaim award: $144,894.
- The risk remains pending the outcome of the appeal.
Potential for New, Small-Scale Technology Initiatives or Regional Expansion Efforts
While the CEO mentioned focusing on 'greater efficiencies in marketing and use of technology' to support record profitability, specific financial figures for new, small-scale technology initiatives are not detailed as distinct Question Mark business units. These efforts are likely being funded from the strong $54.8 million Adjusted EBITDA generated in Q3 2025, but they are currently supporting the existing, established properties rather than representing a major new, low-market-share venture. Regional expansion efforts are not explicitly detailed with associated investment figures, suggesting any such exploration is in a very nascent, cash-consuming stage.
The company's current financial strength is evident:
- Q3 2025 Adjusted EBITDA: $54.8 million.
- Cash on hand as of September 30, 2025: $107.6 million.
- The company operates with no debt.
Disclaimer
All information, articles, and product details provided on this website are for general informational and educational purposes only. We do not claim any ownership over, nor do we intend to infringe upon, any trademarks, copyrights, logos, brand names, or other intellectual property mentioned or depicted on this site. Such intellectual property remains the property of its respective owners, and any references here are made solely for identification or informational purposes, without implying any affiliation, endorsement, or partnership.
We make no representations or warranties, express or implied, regarding the accuracy, completeness, or suitability of any content or products presented. Nothing on this website should be construed as legal, tax, investment, financial, medical, or other professional advice. In addition, no part of this site—including articles or product references—constitutes a solicitation, recommendation, endorsement, advertisement, or offer to buy or sell any securities, franchises, or other financial instruments, particularly in jurisdictions where such activity would be unlawful.
All content is of a general nature and may not address the specific circumstances of any individual or entity. It is not a substitute for professional advice or services. Any actions you take based on the information provided here are strictly at your own risk. You accept full responsibility for any decisions or outcomes arising from your use of this website and agree to release us from any liability in connection with your use of, or reliance upon, the content or products found herein.