
|
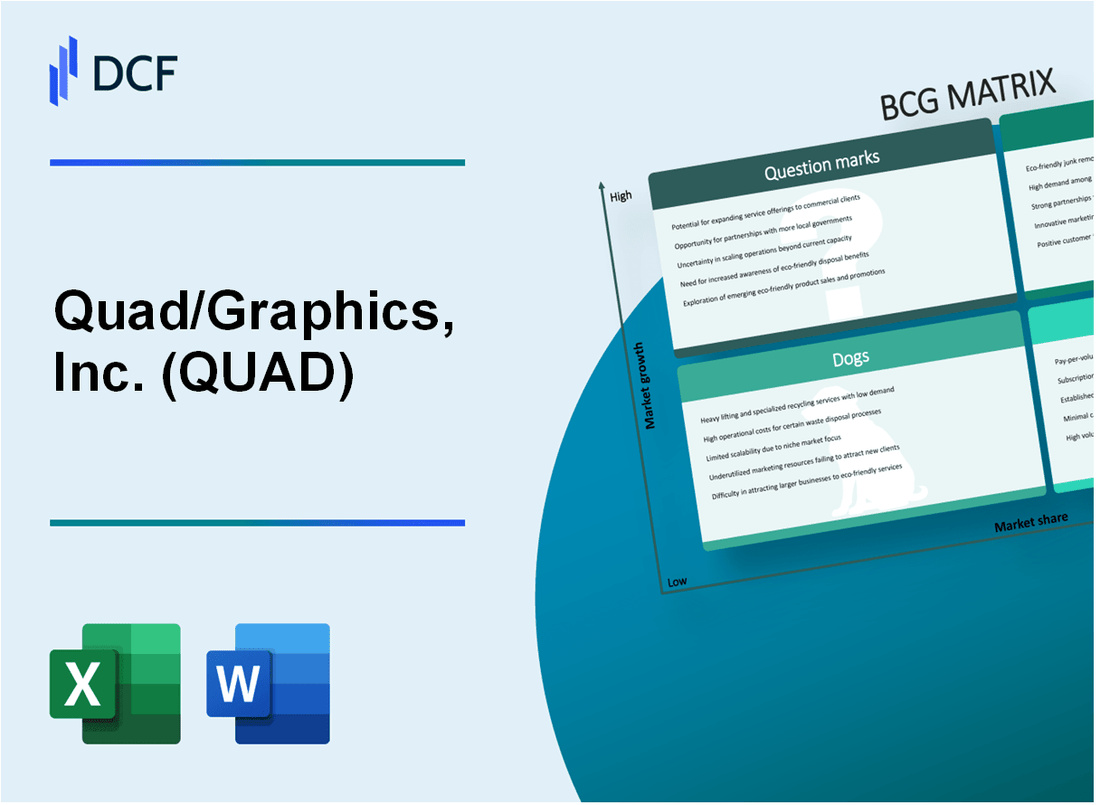
Quad/Graphics, Inc. (QUAD): BCG Matrix [Dec-2025 Updated] |
Fully Editable: Tailor To Your Needs In Excel Or Sheets
Professional Design: Trusted, Industry-Standard Templates
Investor-Approved Valuation Models
MAC/PC Compatible, Fully Unlocked
No Expertise Is Needed; Easy To Follow
Quad/Graphics, Inc. (QUAD) Bundle
You're assessing Quad/Graphics, Inc.'s business right now, and honestly, the picture is a classic case study of a legacy player executing a tough pivot in late 2025. We see clear Stars emerging, like the In-Store Connect retail media network growing 11% year-to-date, while the huge U.S. Print segment acts as the essential Cash Cow, funding the whole operation. But, the transformation isn't clean; there are definite Dogs being shed, and the big strategic bet-the Marketing Experience Solutions suite-is still a Question Mark, as the company expects overall net sales to decline between 3% to 5% this year. Dig into the four quadrants below to see exactly where the capital is being deployed and where the real long-term payoff might be.
Background of Quad/Graphics, Inc. (QUAD)
Quad/Graphics, Inc. (QUAD) is actively navigating a significant shift, moving from its roots as a traditional print provider to what it terms a 'Marketing Experience' (MX) company. This transformation involves integrating creative, production, media, intelligence, and technology solutions to address complex client marketing challenges across all channels, both digital and physical. This strategic pivot is key to understanding the company's current portfolio positioning.
Financially, the nine months ending September 30, 2025, showed a total net sales figure of $1,789.3 million, which was down from $1,963.8 million for the same period in 2024. For the third quarter of 2025 specifically, net sales were $588.0 million, representing a year-over-year decrease of about 12.86%, though management noted the decline was closer to 7% when adjusting for a major divestiture. On the profitability front, the company saw a strong recovery, posting net earnings of $15.9 million for the nine-month period, a substantial improvement from the net loss recorded in 2024. Honestly, bottom-line results are showing the benefits of restructuring efforts.
A major event shaping the current structure was the divestiture of Quad/Graphics, Inc.'s European operations, which was finalized on February 28, 2025. Looking at the U.S. operations for the first nine months of 2025, the United States Print and Related Services segment brought in $1,238.6 million in product sales and $384.5 million in service sales. The remaining International segment contributed product sales of $163.3 million.
The company is doubling down on specific growth areas within its print offerings. For instance, in Q2 2025, targeted print offerings grew to account for 46% of total sales, up from 44% the prior year, while the large-scale print portion shrank from 25% to 23% of sales. Quad/Graphics, Inc. is also heavily investing in its MX Solutions Suite, including launching products like Audience Builder 2.0 and expanding its In-Store Connect retail media network, which secured a partnership with Vallarta Supermarkets in 2025.
Looking ahead to the full year 2025, Quad/Graphics, Inc. reaffirmed guidance projecting a net sales decline between 3% and 5% when excluding the divested European business. They expect adjusted EBITDA to fall within the range of $190 million to $200 million, and the net debt leverage ratio is anticipated to settle around 1.6 times by year-end. Finance: draft the 2026 capital expenditure plan by next Tuesday.
Quad/Graphics, Inc. (QUAD) - BCG Matrix: Stars
Stars are the business units or products with the best market share operating in a high-growth market. Quad/Graphics, Inc. (QUAD) positions several of its evolving service lines in this quadrant, requiring significant investment to maintain leadership while the market expands. These units consume cash to fuel their growth but are expected to transition into Cash Cows as market growth moderates.
The In-Store Connect retail media network is identified as the closest Star candidate, showing 11% year-to-date growth in in-store marketing activities as of the latest reports. This network is actively expanding, evidenced by the partnership with Vallarta Supermarkets and the doubling of the footprint with The Save Mart Companies. The effectiveness of this high-growth area is demonstrated by concrete client results; for example, a campaign for DiGiorno frozen pizza experienced a 23 percentage point sales lift in test stores versus control stores, and a PepsiCo campaign delivered a 25 percentage point sales lift.
Packaging and targeted print offerings represent other high-growth niches within Quad/Graphics, Inc. (QUAD)'s portfolio. The scenario suggests packaging grew by 9% and direct mail grew by 6%. These segments are valuable because they leverage the company's existing print infrastructure while operating in markets that demonstrate higher growth potential and better margins than legacy print products. Year-to-date, the broader category of targeted print offerings, which includes direct mail and packaging, has shown sales increases of 7%.
The strategy for these Stars involves continuous investment to secure market share leadership. Quad/Graphics, Inc. (QUAD) is making strategic capital deployments into technology to enhance the competitive edge of these segments. These investments are focused on data-driven marketing capabilities, which are critical for maintaining the high-growth trajectory.
Key investments supporting the Star quadrant include:
- Strategic investments in AI-powered tools.
- The release of Audience Builder 2.0.
- Enhancing the proprietary household-based data stack.
- Activating data for precision media buying at scale.
The financial commitment to these areas is evident in the company's capital allocation, even while managing overall revenue declines in legacy areas. The goal is to ensure these high-growth areas continue to gain share, moving the company toward its projected net sales inflection point in 2028. The company aims to improve its adjusted EBITDA margin by at least 100 basis points by 2028, with these growth vectors being central to that margin expansion.
Here is a comparison of the growth rates for the key segments identified as Stars, based on the provided analysis framework and recent performance data:
| Segment | Stated Growth Rate (Scenario) | Confirmed YTD Sales Increase (Targeted Print) | Reported Campaign Sales Lift |
| In-Store Connect Retail Media | 11% Year-to-Date Growth | N/A | 23% to 25% lift |
| Packaging | 9% Growth | 7% Increase (as part of Targeted Print) | N/A |
| Direct Mail | 6% Growth | 7% Increase (as part of Targeted Print) | N/A |
Quad/Graphics, Inc. (QUAD) - BCG Matrix: Cash Cows
You're looking at the core engine of Quad/Graphics, Inc. (QUAD) here-the segment that provides the necessary stability and capital for the entire enterprise, even as the market matures. These are the Cash Cows, and for Quad/Graphics, Inc., that title firmly belongs to the large-scale print operations.
This segment is characterized by its high market share in a mature industry, meaning growth is slow, but the cash generation is reliable. The focus here isn't on massive expansion spending, but on efficiency and milking the existing advantage. This is where the company's financial foundation is built.
Here are the key figures that define this Cash Cow status as of the third quarter of 2025:
- Large-scale U.S. Print and Related Services, generating the bulk of the revenue, with $1,238.6 million in product sales YTD Q3 2025.
- This segment holds a dominant market share in a mature industry, providing the capital for strategic investments.
- The business is highly efficient, with Adjusted EBITDA margin improving to 8.9% in Q3 2025 despite sales decline.
- Generates the majority of the projected $50 million to $60 million in free cash flow for full-year 2025.
The efficiency gains are tangible. While year-to-date net sales (excluding the European divestiture) were $1.8 billion for the first nine months of 2025, the operational discipline shows through in the margins. For the third quarter alone, the segment contributed to an Adjusted EBITDA of $53 million.
The strategy for a Cash Cow like this is clear: maintain the position without overspending on promotion, and invest only in infrastructure that drives down unit costs or improves cash conversion. The capital expenditures guidance for the full year 2025 reflects this, being narrowed to between $50 million and $55 million.
Consider the cash flow dynamics:
| Metric | Value (Q3 2025 or FY 2025 Guidance) |
|---|---|
| Q3 2025 Adjusted EBITDA Margin | 8.9% |
| Full-Year 2025 Projected Free Cash Flow | $50 million to $60 million |
| Q3 2025 Adjusted EBITDA | $53 million |
| Full-Year 2025 Capital Expenditures Guidance | $50 million to $55 million |
This unit is the primary source of funds to support the company's other quadrants. The cash flow is used to service corporate debt, pay dividends, and fund the necessary, albeit limited, investments into Question Marks. You see this commitment in the declared quarterly dividend of $0.075 per share.
The focus on efficiency is paramount because the market is mature. We see this in the segment's performance relative to the whole:
- The U.S. Print and Related Services segment accounted for approximately 93% of consolidated net sales in Q3 2025.
- Q3 2025 Net Sales for the segment were $544.8 million.
- The segment's operating income was $36.5 million in Q3 2025.
The goal is to 'milk' these gains passively while making targeted infrastructure investments. For instance, the company is using these funds to support strategic pivots, such as the acquisition of Enru's co-mail assets, which required a cash outlay of $16.3 million year-to-date for the portion of the total estimated purchase price of $27.0 million. This is an investment supporting the existing cash cow's efficiency, not a speculative bet.
Quad/Graphics, Inc. (QUAD) - BCG Matrix: Dogs
Dogs are units or products with a low market share and low growth rates. They frequently break even, neither earning nor consuming much cash. Dogs are generally considered cash traps because businesses have money tied up in them, even though they bring back almost nothing in return. These business units are prime candidates for divestiture.
The divestiture of the European operations, completed on February 28, 2025, immediately impacted reported figures. For the third quarter of 2025, Quad/Graphics, Inc. realized Net Sales of $588 million, which represented a 13% decrease compared to the third quarter of 2024. When isolating the effect of this divestiture, Net Sales declined 7%, meaning the European operations contributed a 6% drag on the reported decline. Year-to-date through September 30, 2025, Net Sales were $1.8 billion, a 9% decrease overall, or a 4% decrease excluding the 5% impact from the European divestiture.
The ongoing pressure in this quadrant stems from specific product and service categories.
| Component | Financial Metric | Value | Period |
| European Operations Divestiture | Impact on Q3 Net Sales Decline | 6% | Q3 2025 |
| Overall Q3 Net Sales | Realized Amount | $588 million | Q3 2025 |
| Overall Q3 Net Sales Decline | Percentage Decrease Year-over-Year | 13% | Q3 2025 |
| Net Sales Decline Excluding Europe | Percentage Decrease Year-over-Year | 7% | Q3 2025 |
| Large-Scale Print (Retail Inserts/Magazines) | Share of Sales Mix (Indicator of Decline) | 23% | Q2 2025 |
Lower-margin, commodity-style paper sales and logistics solutions were cited as primary contributors to the sales contraction. The decline in Net Sales for the third quarter of 2025 was primarily attributed to:
- Lower paper sales.
- Lower print volumes.
- Lower logistics and agency solutions sales.
Traditional, large-volume print product lines, such as magazines and catalogs, are units expected to continue their secular decline, contrasting with the growth seen in targeted print offerings. For instance, in the second quarter of 2025, the share of large-scale print in the sales mix decreased to 23% from 25% in the prior year period. This trend is a key characteristic of a Dog category, where market share erodes due to digital substitution.
The remaining International segment, which is now smaller following the February 28, 2025, divestiture, also experienced reduced net sales. The year-to-date decline in Net Sales for the nine months ended September 30, 2025, included the loss of a large grocery client, which annualized its impact starting in March 2025. This client loss further pressured the logistics and agency solutions sales within the remaining structure.
You should note the following financial context for these units:
- Adjusted EBITDA for Q3 2025 was $53 million, down from $59 million in Q3 2024.
- Year-to-date Adjusted EBITDA through September 30, 2025, was $141 million, compared to $161 million in the same period of 2024.
- The year-to-date Adjusted EBITDA margin contracted from 8.2% in 2024 to 7.9% in 2025.
Quad/Graphics, Inc. (QUAD) - BCG Matrix: Question Marks
You're looking at the new, integrated solutions that Quad/Graphics, Inc. is pouring capital into, which is the core of the strategic transformation aimed at reversing the net sales decline by 2028. This pivot to a marketing experience (MX) provider is supported by proprietary data accessing 92% of U.S. households via MX Intelligence. The long-term financial target tied to this transformation is to increase the adjusted EBITDA margin to 9.4% by 2028. Still, the near-term reality shows these investments are consuming cash, as evidenced by the recent quarterly performance.
Here's a quick look at how the investment phase is hitting profitability metrics:
| Metric | Q3 2025 Value | Q3 2024 Value |
| Adjusted EBITDA | $53 million | $59 million |
| Adjusted EBITDA (Nine Months) | $141 million | $161 million |
| Net Sales (Q3) | $588 million | $675 million |
| Net Sales (Nine Months, ex-Europe Divestiture) | Decline of 4% | Decline of 9.7% (Full Year 2024) |
The pressure on immediate returns is clear. Adjusted EBITDA for the third quarter of 2025 landed at $53 million, which is down from $59 million in the third quarter of 2024. This dip is directly attributed to the impact of lower net sales combined with increased investments in innovative offerings designed to drive future revenue growth. For the first nine months of 2025, the cumulative Adjusted EBITDA was $141 million, against $161 million for the same period in 2024.
The In-Store Connect retail media network is a prime example of a high-growth area consuming resources while market share is still being established against larger competitors. To demonstrate its effectiveness, recent 2025 campaigns showed significant client success, including a 23 percentage point sales lift for Nestlé USA's DiGiorno frozen pizza in test stores versus control stores. Another campaign for PepsiCo's Rockstar Energy drink saw a 25 percentage points sales lift. The network has expanded its physical footprint, growing to over 45 grocery stores with another 30 locations added.
Despite the focus on these new segments, the core business headwinds persist, meaning the new growth hasn't fully compensated for the legacy decline yet. For the full year 2025, Quad/Graphics, Inc. is still projecting an adjusted annual net sales change in the range of a 3% to 5% decline, with the midpoint reaffirmed at a 4% decline. This is an improvement from the 9.7% net sales decline reported for the full year 2024, but it confirms that the Question Marks are still net cash users.
Disclaimer
All information, articles, and product details provided on this website are for general informational and educational purposes only. We do not claim any ownership over, nor do we intend to infringe upon, any trademarks, copyrights, logos, brand names, or other intellectual property mentioned or depicted on this site. Such intellectual property remains the property of its respective owners, and any references here are made solely for identification or informational purposes, without implying any affiliation, endorsement, or partnership.
We make no representations or warranties, express or implied, regarding the accuracy, completeness, or suitability of any content or products presented. Nothing on this website should be construed as legal, tax, investment, financial, medical, or other professional advice. In addition, no part of this site—including articles or product references—constitutes a solicitation, recommendation, endorsement, advertisement, or offer to buy or sell any securities, franchises, or other financial instruments, particularly in jurisdictions where such activity would be unlawful.
All content is of a general nature and may not address the specific circumstances of any individual or entity. It is not a substitute for professional advice or services. Any actions you take based on the information provided here are strictly at your own risk. You accept full responsibility for any decisions or outcomes arising from your use of this website and agree to release us from any liability in connection with your use of, or reliance upon, the content or products found herein.