
|
Saga Communications, Inc. (SGA): ANSOFF MATRIX [Dec-2025 Updated] |
Fully Editable: Tailor To Your Needs In Excel Or Sheets
Professional Design: Trusted, Industry-Standard Templates
Investor-Approved Valuation Models
MAC/PC Compatible, Fully Unlocked
No Expertise Is Needed; Easy To Follow
Saga Communications, Inc. (SGA) Bundle
You're looking at the next few years for Saga Communications, Inc. (SGA), and honestly, the roadmap is clearer than most media plays right now. After reviewing their Q3 2025 position-sitting on $34.2 million in cash and seeing interactive revenue jump 32.6%-we can map out exactly where they are pushing for growth. We're talking about everything from squeezing 3% more from existing radio ads to potentially diving into EdTech or launching a national programmatic platform, all while earmarking $3.25 million to $3.75 million for new content tech. If you need to see the concrete actions for maximizing their current footprint or making that next big leap, the full Ansoff Matrix breakdown is right below.
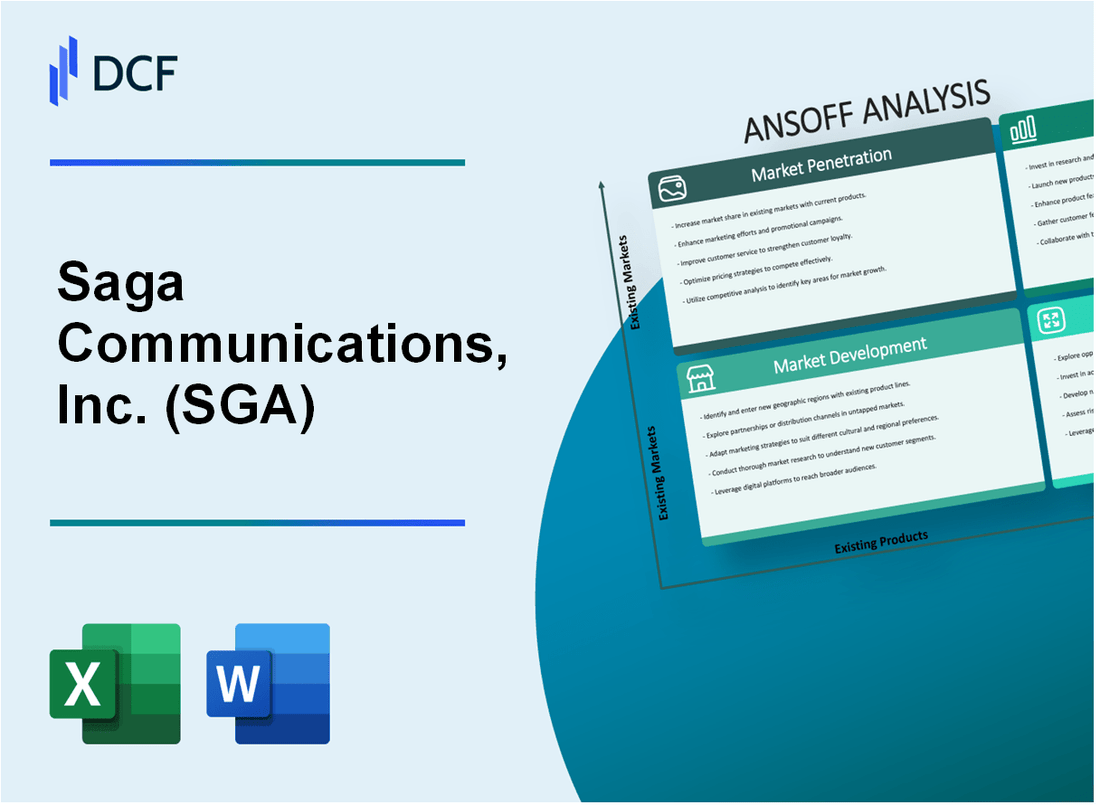
Saga Communications, Inc. (SGA) - Ansoff Matrix: Market Penetration
You're looking at how Saga Communications, Inc. (SGA) plans to squeeze more revenue from the assets it already has. This is about digging deeper into the existing customer base and service areas. It's a classic move when the market is tough, which the Q3 2025 numbers definitely reflect, showing a net revenue dip of 1.8% to $28.2 million for the quarter.
The first action item here is pushing up prices on the current inventory. Saga Communications, Inc. (SGA) operates 82 FM and 31 AM radio stations across 28 markets. The plan is to increase local ad rates on these stations by 3% as a direct offset against broadcast revenue declines.
Next, you need to aggressively cross-sell that blended advertising model. This push is focused squarely on the existing client base within all 28 markets. The company is trying to make sure every client buys both traditional radio spots and the newer digital inventory. This is key because the Q3 32.6% year-over-year interactive revenue growth almost entirely covered the broadcast revenue decrease when political dollars are backed out.
Targeted promotions are the engine for converting listeners to digital platforms. The digital momentum is real; by May 8, 2025, Saga Communications, Inc. (SGA) had already generated $5.3 million in search, display, and social revenue, which surpassed all of 2024's total digital revenue. The goal is to capture about 5% of the available search and display dollars in their 27 markets.
You've got to leverage that 32.6% interactive revenue growth from Q3 2025. This digital success is what management is counting on to offset the softness in traditional spots, like the political revenue drop from $0.677M in Q3 2024 to just $0.073M in Q3 2025. The total interactive revenue as of May 8, 2025, was already $12.5 million.
Finally, optimization is about maximizing yield on the existing signal footprint. Saga Communications, Inc. (SGA) needs to fine-tune the 79 metro signals it operates. Better audience measurement directly translates to higher ad yield, which is critical when the nine-month net revenue is down 3.7% to $80.6 million. Here's a quick look at the operational scale for this strategy:
| Asset Type | Count |
| Total Markets | 28 |
| FM Stations | 82 |
| AM Stations | 31 |
| Metro Signals | 79 |
The company is also managing expenses tightly, guiding for station operating expense to be flat year-over-year for FY 2025, or down 2-3% excluding the music licensing settlement impact. Plus, corporate general and administrative expense is expected to be about $12 million for 2025.
To execute this, you should focus on the immediate conversion metrics:
- Track local ad rate realization against the 3% target.
- Monitor cross-sell penetration rate across the 28 markets.
- Measure listener-to-digital conversion rates monthly.
- Review yield per signal for the 79 metro signals.
- Ensure digital revenue pacing stays above the +32% mark seen in Q4 pacing guidance.
Finance: draft the Q4 2025 pacing analysis against the $28.5 million consensus revenue target by next Tuesday.
Saga Communications, Inc. (SGA) - Ansoff Matrix: Market Development
You're looking at how Saga Communications, Inc. can deploy capital and existing digital expertise into new geographic areas. This Market Development quadrant focuses on taking what works now and applying it elsewhere.
The plan starts with leveraging the balance sheet. As of November 3, 2025, Saga Communications, Inc. held 34.2 million in cash and short-term investments. This liquidity provides the foundation for expansion, specifically targeting the acquisition of broadcast properties in new, adjacent mid-sized markets, which Saga defines as those ranked between 20-200 by market revenues. This focus on the 20-200 tier aligns with the company's historical strategy of operating top billing stations in these specific segments. Saga currently serves 28 markets, which provides a strong template for demographic and format replication.
The capital structure optimization also frees up funds for entry costs. The recent sale of 22 tower sites closed on October 17, 2025, for a total consideration of approximately 10.7 million. The net proceeds, which management intends to use in part for capital allocation plans like buybacks, can also fund the initial market entry costs in new states. The upfront net proceeds were approximately 8.7 million, with 1.8 million placed into escrow.
Digital expansion is a key component that doesn't require immediate radio asset purchase. The existing 'Click, Visit, Call and Search' digital platform can be launched in 3-5 new US markets. This digital offering is already showing momentum; digital ad revenue generated 5.3 million by May 2025, surpassing the 5.0 million generated in all of 2024.
Here's a quick look at the operational footprint and the planned expansion scope:
| Metric | Current State (as of late 2025) | Market Development Target |
| Current Markets Operated In | 28 | New Adjacent Markets |
| Total Radio Stations (Approximate) | 113 (82 FM + 31 AM) | Expand Digital Platform in 3-5 Markets |
| Cash & Short-Term Investments (Nov 3, 2025) | 34.2 million | Fund Initial Market Entry Costs |
| Tower Sale Proceeds Available | 10.7 million | Fund Initial Market Entry Costs |
To support this geographic expansion, Saga Communications, Inc. can partner with regional e-commerce platforms. The current business model already incorporates digital and e-commerce solutions alongside its core radio offerings, making this a natural extension of existing services to new client bases.
The success of this strategy hinges on careful selection. You must target markets that mirror the demographic profiles of the current 28 markets. This similarity helps ensure that the existing programming formats-which include Active Rock, Country, and News/Talk-will find immediate content and format success.
The immediate action item is for the Corporate Development team to model the initial capital outlay for launching the digital platform in 3 markets versus the cost of acquiring a single station in a Rank 100 market, using the 10.7 million tower sale proceeds as a dedicated, non-cash reserve funding source for these initial steps. Finance: draft 13-week cash view by Friday.
Saga Communications, Inc. (SGA) - Ansoff Matrix: Product Development
You're looking at how Saga Communications, Inc. (SGA) can build new revenue streams within its existing 28 markets, which currently house 82 FM and 31 AM radio stations. This Product Development strategy focuses on monetizing the existing audience base and local business relationships with new offerings.
For new product development, you need to earmark funds. Saga Communications, Inc. (SGA) expects to spend between $3.25 million and $3.75 million for capital expenditures during 2025. That's a reduction from earlier guidance, which was set between $4.0 million and $4.5 million. For context, capital expenditures for the nine-month period ending September 30, 2025, totaled $2.6 million.
Here's a quick look at the financial backdrop as you plan these investments:
| Metric | Value (as of 9/30/2025 or FY 2025 Guidance) |
|---|---|
| Q3 2025 Net Revenue | $28.2 million |
| Nine-Month 2025 Net Revenue | $80.6 million |
| FY 2025 Expected CapEx Range | $3.25 million - $3.75 million |
| Q3 2025 Interactive Revenue YoY Growth | 32.6% |
| Cash & Short-Term Investments (9/30/2025) | $26.3 million |
| Proceeds from Tower Sale | Approximately $10.7 million |
To introduce a high-margin, proprietary local data analytics service for advertisers in current markets, you're building on existing digital momentum. Interactive revenue grew 32.6% year-over-year in the third quarter of 2025. Management has a target to capture approximately 5% of search/display revenue across the 27 markets where this service would be applicable, aiming to double gross revenue in 18-24 months, with most of that growth being digital.
Developing premium, subscription-based digital audio content, like podcasts, for existing radio station audiences is a direct extension of your current product base. This leverages existing listener habits. The company's digital transformation efforts saw interactive revenue gains almost entirely offset broadcast revenue decreases when adjusted for political advertising in the nine-month period ending September 30, 2025. This suggests a strong appetite for non-traditional, digital-first content.
Launching new e-commerce storefront solutions for local businesses expands beyond current digital offerings, moving into transaction facilitation. This is a logical next step given the 32.6% interactive revenue growth seen in Q3 2025. You'll want to ensure the investment in new content creation technology, perhaps a portion of that $3.25 million to $3.75 million CapEx budget, directly supports the infrastructure for these new digital storefronts.
Creating a defintely new, non-traditional revenue stream from local event ticketing and promotion services taps directly into local community engagement. This type of offering complements radio's local focus. The company has a strong cash position, holding $26.3 million in cash and short-term investments as of September 30, 2025, plus it secured approximately $10.7 million from the sale of telecommunications towers, providing capital flexibility for these new ventures.
You must invest a portion of the $3.25 million to $3.75 million CapEx into new content creation technology. This investment is crucial to support the backend for the proposed analytics service and premium audio content. For example, the capital expenditures for the first six months of 2025 totaled $2.0 million, showing spending is occurring, but a targeted allocation for new content tech is necessary for this Product Development push.
- Targeting approximately 5% share of search/display in 27 markets.
- Interactive revenue pacing up 32% for Q4 2025.
- Nine-month interactive revenue growth was 17.1%.
- Total CapEx guidance for 2025 is $3.25 million to $3.75 million.
- Q3 2025 CapEx was $600 thousand.
Finance: draft 13-week cash view by Friday.
Saga Communications, Inc. (SGA) - Ansoff Matrix: Diversification
You're looking at growth outside the core radio business, which saw Q3 2025 net revenue dip to $28.2 million, a 1.8% drop year-over-year. Diversification here means deploying capital into genuinely new areas, not just expanding existing digital efforts, though that digital push is key to the stated objective of doubling gross revenue in 18 to 24 months by capturing 5% of search and display dollars in your 27 Saga markets. You have the war chest to make these moves; as of November 3, 2025, Saga Communications, Inc. held $34.2 million in cash and short-term investments, plus you just closed a tower sale bringing in approximately $10.7 million.
Consider acquiring a small, regional digital marketing agency specializing in non-media-related services like SEO or web development. This move directly supports the digital revenue acceleration goal. For context on your current digital performance, your gross interactive revenue grew 32.6% year-over-year in Q3 2025, which is strong, but this acquisition would bring in entirely new service revenue streams. The 9-month net revenue for 2025 stood at $80.6 million, showing the scale you are working with as you look for bolt-on acquisitions.
Entering the educational technology (EdTech) market by developing local vocational training content for new markets is a true diversification play. This leverages your local market knowledge across your 28 markets but applies it to a new product category. The current corporate general and administrative expense is anticipated to be around $12 million for 2025, which suggests a lean corporate structure that could absorb a small EdTech venture without immediate, massive overhead strain, assuming the initial investment stays within the expected capital expenditure range of $3.25 million to $3.75 million for 2025.
Investing in a minority stake in a non-traditional media venture, such as a local fiber-optic network or data center, hedges against future declines in traditional advertising spend. This is a capital-light way to gain exposure. You are already monetizing non-core assets, having sold 22 tower sites for about $10.7 million, with $1.8 million still in escrow pending consents. This cash event provides immediate dry powder for such strategic minority investments.
Utilizing the strong cash position to acquire a small portfolio of non-radio, non-digital media assets in a new geographic region offers market diversification. You could look at small-market print or out-of-home assets in a region where your current radio footprint is nonexistent. This contrasts sharply with the political revenue performance in Q3 2025, which fell to just $73,000 from $677,000 the prior year, highlighting the need for more stable, non-cyclical revenue streams outside of your established media types.
Launching a national programmatic advertising platform is a new product in a new market, aiming to accelerate the goal of 67% digital revenue by 2030 (as per your stated long-term objective). This is a product development play that also serves as diversification from local-only sales. The Q3 2025 results showed a net loss of $532 thousand, which means any national platform launch needs careful staging to avoid immediate cash burn, perhaps phasing the rollout across your existing 28 markets before going fully national.
Here's a quick look at the financial context supporting these diversification discussions:
| Metric | Value (Latest Reported) | Period/Date |
| Cash & Short-Term Investments | $34.2 million | November 3, 2025 |
| 9M 2025 Net Revenue | $80.6 million | Ended September 30, 2025 |
| Q3 2025 Interactive Revenue Growth | +32.6% | Year-over-Year |
| Tower Sale Proceeds (Total Agreement) | $10.7 million | Agreement reached October 17, 2025 |
| Q3 2025 Net Loss | $532 thousand | Quarter Ended September 30, 2025 |
| 2025 Expected Capital Expenditures | $3.25M to $3.75M | Full Year 2025 Estimate |
The current operational headwinds, such as the music licensing settlement expense which negatively impacted Q3 2025 results, make diversification critical. Without that settlement expense, station operating income would have been $5.6 million for the quarter instead of the reported $3.5 million. You're already committed to shareholder returns, having paid a quarterly dividend of $0.25 per share on September 19, 2025, totaling about $1.6 million, so any new venture must be funded without jeopardizing that commitment or the ongoing buyback plans funded by the tower sale.
The areas for potential new product/market entry include:
- Acquiring a non-media digital services firm.
- Developing vocational training content for new geographic areas.
- Taking a minority stake in infrastructure like fiber or data centers.
- Purchasing non-radio media assets in new regions.
- Launching a national programmatic ad product.
Finance: draft 13-week cash view by Friday.
Disclaimer
All information, articles, and product details provided on this website are for general informational and educational purposes only. We do not claim any ownership over, nor do we intend to infringe upon, any trademarks, copyrights, logos, brand names, or other intellectual property mentioned or depicted on this site. Such intellectual property remains the property of its respective owners, and any references here are made solely for identification or informational purposes, without implying any affiliation, endorsement, or partnership.
We make no representations or warranties, express or implied, regarding the accuracy, completeness, or suitability of any content or products presented. Nothing on this website should be construed as legal, tax, investment, financial, medical, or other professional advice. In addition, no part of this site—including articles or product references—constitutes a solicitation, recommendation, endorsement, advertisement, or offer to buy or sell any securities, franchises, or other financial instruments, particularly in jurisdictions where such activity would be unlawful.
All content is of a general nature and may not address the specific circumstances of any individual or entity. It is not a substitute for professional advice or services. Any actions you take based on the information provided here are strictly at your own risk. You accept full responsibility for any decisions or outcomes arising from your use of this website and agree to release us from any liability in connection with your use of, or reliance upon, the content or products found herein.