
|
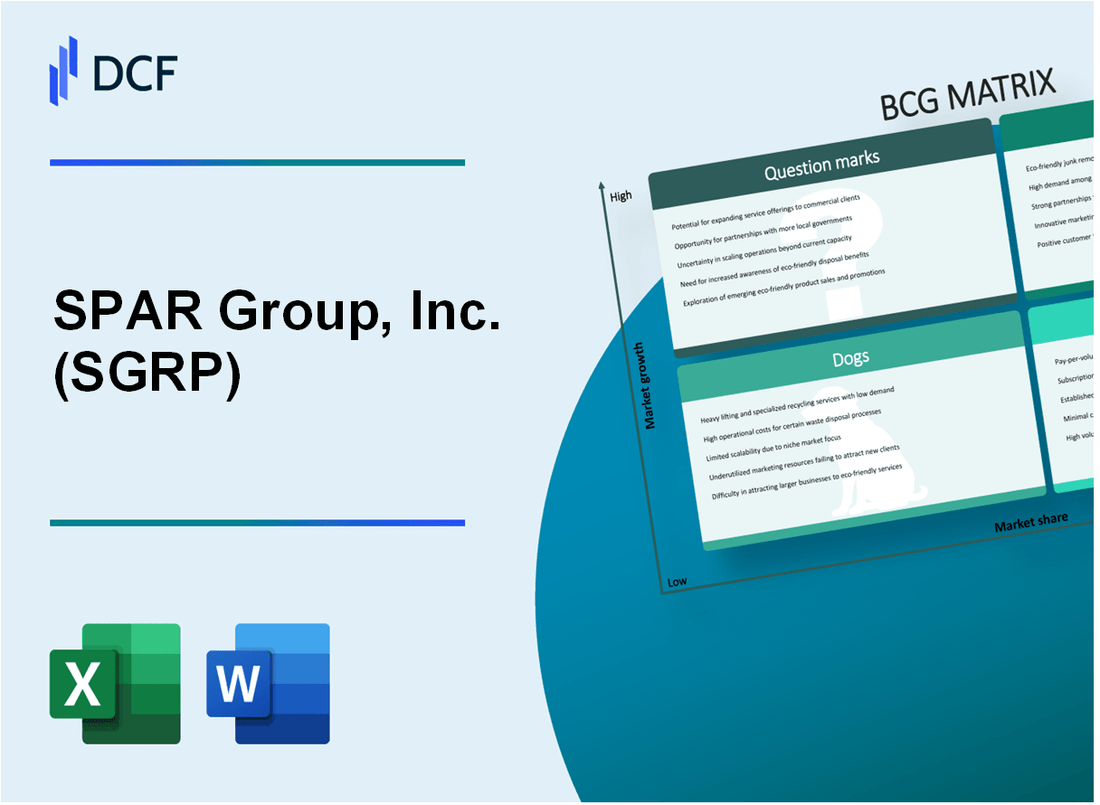
SPAR Group, Inc. (SGRP): BCG Matrix [Dec-2025 Updated] |
Fully Editable: Tailor To Your Needs In Excel Or Sheets
Professional Design: Trusted, Industry-Standard Templates
Investor-Approved Valuation Models
MAC/PC Compatible, Fully Unlocked
No Expertise Is Needed; Easy To Follow
SPAR Group, Inc. (SGRP) Bundle
You're looking at the definitive late 2025 strategic snapshot for SPAR Group, Inc. following its decisive North American realignment. Honestly, the portfolio clarity is striking: we see Stars emerging from high-margin domestic data services and specialized e-commerce execution, while the bedrock of the business-core U.S. merchandising-continues to function as a dependable Cash Cow, funding the next phase. Still, the cleanup is real, with low-margin international units firmly in the Dogs quadrant, and the future hinges on heavy capital allocation toward promising but unproven tech like AI optimization platforms, which are currently our biggest Question Marks. This map shows exactly where to invest, hold, or divest right now.
Background of SPAR Group, Inc. (SGRP)
SPAR Group, Inc. (SGRP) operates as a leading merchandising, marketing, and distribution services company, primarily serving retailers, manufacturers, and distributors across North America. You should know that the company has over 50 years of experience in this space, executing an average of more than 30,000 store visits weekly across the United States and Canada. This focus on the domestic market is a recent, major strategic shift, as SPAR Group completed the exit of all its international joint ventures in places like Mexico, China, Japan, and India during 2025.
The financial reporting for 2025 reflects this transition, making year-over-year comparisons complicated. For instance, the second quarter of 2025 saw net revenues of $38.6 million for the continuing U.S. and Canada businesses, which was up 13.5% sequentially from the first quarter. Still, the company reported its third quarter 2025 net revenues at $41.4M, with the comparable U.S. and Canada segment showing strong growth of 28.2% year-over-year.
Operationally, the focus is clearly on the North American market, where management cites having the largest pipeline of opportunity in the company's history, exceeding $200 million in potential future business. However, profitability has been uneven; the first six months of 2025 resulted in a net income of only $0.5 million, a significant drop from the prior year's comparable period which included non-cash gains. Liquidity remains a focus, with total liquidity reported at $10.4 million at the end of Q3 2025, supported by expanded revolving credit facilities totaling $36 million through October 2027.
The latter half of 2025 brought significant organizational changes as SPAR Group repositions for this focused future. The company announced leadership transitions, appointing William Linnane as President and later as Permanent Chief Executive Officer, and naming Josh Jewett as the new Chief Technology Officer in October 2025 to drive retail innovation. Furthermore, SPAR Group is consolidating its corporate functions, planning to relocate its headquarters to Charlotte, North Carolina, effective November 1, 2025.
SPAR Group, Inc. (SGRP) - BCG Matrix: Stars
You're looking at the segments within SPAR Group, Inc. (SGRP) that are clearly in the high-growth, high-market-share category-the Stars. These are the areas where the market is expanding rapidly, and SPAR Group is capturing significant business, even if it means pouring cash back in to maintain that lead. Honestly, the North American operations are where this story is playing out right now.
The combined U.S. and Canada business is showing the kind of momentum you want to see in a Star. For the third quarter of 2025, the comparable net revenues for the U.S. and Canada jumped by 28.2% year-over-year. That's serious growth, indicating that SPAR Group is successfully leading in a growing market, which is the core definition of a Star. To be fair, the first quarter showed a more modest 6% topline growth in this region, but the second half momentum, with Q2 up 13.5% sequentially, suggests acceleration. Management even expects the second half of 2025 growth to outpace the first half.
The focus here is on maintaining that leadership position, which requires heavy investment. SPAR Group's strategic imperative is driving continued revenue growth, specifically targeting higher margin merchandising services for retailers and consumer packaged goods clients. This is where the investment dollars are going-to solidify the market share in these premium service lines.
The sheer scale of potential business confirms this segment's leadership status. SPAR Group continues to build on what they call the largest pipeline of opportunity in the company's history for the U.S. and Canada business, with more than $200 million of future business to win. This pipeline acts as a proxy for high relative market share potential in a growing environment.
Here's a quick look at the recent North American segment performance that positions it as a Star:
| Metric | Period Ended September 30, 2025 (Q3) | Period Ended March 31, 2025 (Q1) |
| U.S. & Canada Net Revenue Growth (YoY Comparable) | 28.2% | 6% |
| U.S. & Canada Net Revenue Growth (Sequential from Q1 to Q2) | N/A | 13.5% |
| Future Business Opportunity Pipeline (U.S. & Canada) | Over $200 million | Over $200 million |
| U.S. & Canada Gross Margin (Q2 2025) | N/A | 23.5% |
The specialized retail execution programs, which support high-growth areas like e-commerce fulfillment, are embedded within this strong North American performance. While specific revenue for 'data and analytics services' isn't isolated, the overall push toward technology and AI by the new CTO, Josh Jewett, is meant to drive innovation and competitive differentiation across the entire go-to-market strategy. This technological push is the necessary support investment for a Star to maintain its growth trajectory.
For the Canadian merchandising market specifically, the data lumps it with the U.S., but the combined growth rate strongly suggests SPAR Group is a market leader there, too. The strategic focus for 2026 includes heightening the focus on cash generation and working capital discipline, which is the classic move for a Star-you invest heavily until the market matures, then you harvest the returns as a Cash Cow. You want to see them keep pouring resources into this segment.
Key operational indicators supporting the Star status include:
- Continued focus on higher margin merchandising services.
- The appointment of a new CTO to accelerate technology and AI use.
- A pipeline exceeding $200 million in future contracts.
- Strong sequential revenue growth in Q2 2025 of 13.5%.
The goal is clear: sustain this success until the high-growth market slows down, at which point these operations should transition into reliable Cash Cows for SPAR Group, Inc.
SPAR Group, Inc. (SGRP) - BCG Matrix: Cash Cows
Core U.S. merchandising and in-store execution services represent the segment positioned as a Cash Cow, characterized by a mature, stable market base. This segment has historically provided the foundation for SPAR Group, Inc.'s operations.
The scale of this core business is evident when looking at the 2024 fiscal year revenues for the primary components of the Americas segment, which reflect the established market share before the 2025 strategic focus shift. For the full year 2024, U.S. net revenues were reported at $117.5 million, and Canada net revenues were $14.30 million.
This core business provides consistent, albeit fluctuating, operating cash flow metrics. For the nine months ended September 30, 2025, consolidated net revenues reached $114.1 million. Within this period, the U.S. and Canada operations showed strong momentum, with comparable net revenues up 12.6% versus the prior year period. The most recent quarter, Q3 2025, showed even stronger comparable growth for U.S. and Canada net revenues, increasing 28.2% year-over-year.
The profit margin profile for the consolidated entity, which includes this core business, was 21.1% for the first nine months of 2025, compared to 20.8% in the prior year period. However, the third quarter of 2025 saw a consolidated Gross Margin of 18.6% of sales. The company is actively working to build a structurally higher-margin business.
Investments into supporting infrastructure, such as technology and cost discipline, are a current focus to improve cash flow efficiency. The company is targeting a reduction in selling, general, and administrative expenses to approximately $6.5 million per quarter or lower, excluding legal and one-time items. The company's liquidity position as of September 30, 2025, stood at total liquidity of $10.4 million, with $8.2 million in cash and cash equivalents. Furthermore, revolving credit facilities were amended and expanded to $36 million, with an extension until October 2027.
The cash consumption aspect is reflected in the operating activities for the nine months ending September 30, 2025, where net cash used by operating activities was $16.0 million. This usage was partly driven by accounts receivable growth and a program management agreement with a large retailer.
Long-standing client relationships with major big-box retailers and grocers support the high market share position. The company maintains a pipeline of over $200 million in future business opportunities, primarily in the U.S. and Canada.
Key financial metrics for the core business context:
| Metric | Value (2024 Full Year) | Value (9 Months Ended Sept 30, 2025) | Value (Q3 2025) |
| U.S. Net Revenues | $117.5 million | N/A | N/A |
| Canada Net Revenues | $14.30 million | N/A | N/A |
| Consolidated Net Revenues | $196.8 million | $114.1 million | $41.4 million |
| U.S. & Canada Comparable Revenue Growth (YoY) | 11% (U.S.) / 14.5% (Canada) | 12.6% | 28.2% |
| Consolidated Gross Margin | 81.1% Cost of Revenue | 21.1% | 18.6% |
| Net Cash Used by Operating Activities | Negative $665,000 | $16.0 million used | N/A |
The focus on maintaining productivity and efficiency in this segment is supported by:
- Long-term relationships with leading manufacturers and retail businesses.
- A pipeline of future business opportunities exceeding $200 million.
- Revolving credit facilities extended until October 2027.
- A stated imperative to heighten focus on cash generation and working capital discipline.
SPAR Group, Inc. (SGRP) - BCG Matrix: Dogs
DOGS (low growth products (brands), low market share):
Divested or non-core international subsidiaries, which were low-margin and high-risk, are candidates for this quadrant. SPAR Group concluded the disposal of SPAR Poland in January 2025. Furthermore, the group announced plans in May 2025 to dispose of its Swiss operations and AWG in the UK. These European operations, classified as discontinued assets, incurred post-tax losses including impairments amounting to R4.4bn. The sales declines in Q2 2025 reflect the exit from joint ventures in Mexico, China, Japan, and India.
Legacy, non-strategic domestic services with declining client demand and low profitability are also represented by the sharp decline in net income from continuing operations. For the first quarter of 2025, net income from continuing operations was $0.5 million, or $0.02 per diluted share. This compares to a net income of $6.6 million, or $0.26 per diluted share, in the first quarter of 2024, where the prior year included a $7.2 million non-cash gain on sale. The third quarter of 2025 showed a GAAP Net loss attributable to SPAR Group, Inc. of ($8.8) million, or ($0.37) per diluted share. The non-GAAP adjusted diluted loss per common share for Q3 2025 was ($0.10), against an adjusted diluted income of $0.05 in the prior year quarter.
The financial profile of these units, which are being exited or are underperforming the core business, is detailed below:
| Metric | Divested/Discontinued Operations (Approximate) | Continuing Operations (Q1 2025) | Continuing Operations (Q3 2025 GAAP) |
| Revenue Impact (YoY Comparison) | Sales declines reflecting exit of JVs | Net Revenues of $34.0 million | Net Revenues of $41.4 million |
| Profitability (Net Income/Loss) | Post-tax losses including impairments of R4.4bn (Swiss/AWG) | Net Income of $0.5 million | Net Loss of ($8.8) million |
| Margin/EPS | Low-margin and high-risk | EPS of $0.02 per diluted share | EPS of ($0.37) per diluted share |
Services that require significant manual labor without technology integration are implicitly those where cost management is a priority, as the company is accelerating the use of technology and AI. The company incurred approximately $4.0 million of restructuring costs and severance in the third quarter of 2025. Excluding one-time costs, third quarter 2025 Selling, General & Administrative (SG&A) expenses were $7.6 million, with a near-term target to cut these costs below $6.5 million quarterly.
The strategic imperative for these units is minimization or divestiture, as evidenced by the actions taken:
- Finalized disposal of SPAR Poland in January 2025.
- Announced intention to dispose of Swiss operations and AWG in the UK in May 2025.
- Focus on driving growth within higher margin merchandising services.
- Restructuring costs and severance of $4.0 million recognized in the nine months ended September 30, 2025.
SPAR Group, Inc. (SGRP) - BCG Matrix: Question Marks
You're looking at the areas within SPAR Group, Inc. where rapid market expansion potential exists, but the company's current footprint is small, meaning these units are burning cash to gain traction. These are the Question Marks, demanding significant capital allocation to either become Stars or be divested.
Emerging technology-enabled services, like AI-driven labor optimization platforms.
SPAR Group, Inc. is signaling a clear intent to shift resources toward technology, evidenced by the hiring of a new Chief Technology Officer (CTO) to drive digital innovation and AI as a differentiator into fiscal year 2026. This pivot suggests new service offerings, likely including AI-driven labor optimization platforms, are being treated as Question Marks. These initiatives require heavy upfront investment in development and market entry, which contributes to the overall cash consumption. For the first three quarters of 2025, net cash used by operating activities totaled $16.0 million, a clear indicator of capital being deployed into growth vectors that haven't yet generated commensurate returns.
Expansion into new, high-growth service verticals outside of traditional retail execution.
The North American business, which is the current focus post-divestiture of international joint ventures, is showing significant growth momentum, which can be interpreted as the high-growth market for these new service lines. Combined U.S. and Canada net revenue growth was +28.2% year-over-year in the third quarter of 2025 on a comparable basis. However, the consolidated gross margin fell to 18.6% in Q3 2025, compared to 22.3% in the third quarter of the prior year, suggesting that the mix shift toward these newer, less mature, or more investment-heavy services is weighing on immediate profitability. The pipeline of over $200 million in potential future business for the U.S. and Canada segment represents the potential for these Question Marks to mature into Stars.
Pilot programs for new digital audit and compliance solutions with high investment needs.
The strategic reset under new leadership emphasizes building a structurally leaner, higher-margin business, which necessitates the adoption of digital tools like audit and compliance solutions. These pilot programs are classic Question Marks: high potential in a growing regulatory/efficiency market, but low current revenue contribution and high initial investment. The company's total liquidity tightened sequentially to $10.4 million at the end of Q3 2025, with only $2.2 million in unused availability on its credit lines, illustrating the tight cash situation created by funding these high-investment, low-share initiatives alongside restructuring costs.
Low current market share in a rapidly growing segment, demanding heavy capital allocation.
The core challenge for these new ventures is translating high growth prospects into dominant market share quickly. The U.S. and Canada business showed sequential revenue growth of 13.5% from Q1 to Q2 2025, indicating a rapidly expanding market environment. Yet, the overall financial picture shows strain, with Adjusted EBITDA in Q3 2025 being minimal at $0.09 million, representing a 0.2% margin. This low return on sales, coupled with $4.0 million in restructuring and severance costs and $1.6 million in other unusual one-time costs in Q3 2025, confirms these Question Marks are currently consuming cash. The decision point is clear: invest heavily to capture share or divest.
| Metric Category | Financial/Statistical Value (2025 Data) | Context/Timeframe |
| U.S. & Canada YoY Revenue Growth | +28.2% | Q3 2025 (Comparable Basis) |
| Net Cash Used by Operating Activities | $16.0 million | Year-to-Date (Through Q3 2025) |
| Future Business Pipeline Value | Over $200 million | U.S. and Canada Business |
| Consolidated Gross Margin | 18.6% | Q3 2025 |
| Q3 Adjusted EBITDA Margin | 0.2% | Q3 2025 |
| Total Liquidity | $10.4 million | End of Q3 2025 |
You need to watch the capital deployment against the pipeline conversion. If the technology investments don't start showing a margin improvement above the 18.6% consolidated gross margin in the next two quarters, the cash burn rate of $16.0 million YTD will become unsustainable without a clear path to Star status.
- Pivot to technology and AI as a differentiator into 2026.
- High investment needs reflected in $16.0 million YTD operating cash usage.
- Low current profitability: Q3 Adjusted EBITDA margin at 0.2%.
- High growth potential indicated by $200 million pipeline.
Finance: draft 13-week cash view by Friday, focusing on the capital required to support the Q4 technology rollout.
Disclaimer
All information, articles, and product details provided on this website are for general informational and educational purposes only. We do not claim any ownership over, nor do we intend to infringe upon, any trademarks, copyrights, logos, brand names, or other intellectual property mentioned or depicted on this site. Such intellectual property remains the property of its respective owners, and any references here are made solely for identification or informational purposes, without implying any affiliation, endorsement, or partnership.
We make no representations or warranties, express or implied, regarding the accuracy, completeness, or suitability of any content or products presented. Nothing on this website should be construed as legal, tax, investment, financial, medical, or other professional advice. In addition, no part of this site—including articles or product references—constitutes a solicitation, recommendation, endorsement, advertisement, or offer to buy or sell any securities, franchises, or other financial instruments, particularly in jurisdictions where such activity would be unlawful.
All content is of a general nature and may not address the specific circumstances of any individual or entity. It is not a substitute for professional advice or services. Any actions you take based on the information provided here are strictly at your own risk. You accept full responsibility for any decisions or outcomes arising from your use of this website and agree to release us from any liability in connection with your use of, or reliance upon, the content or products found herein.