
|
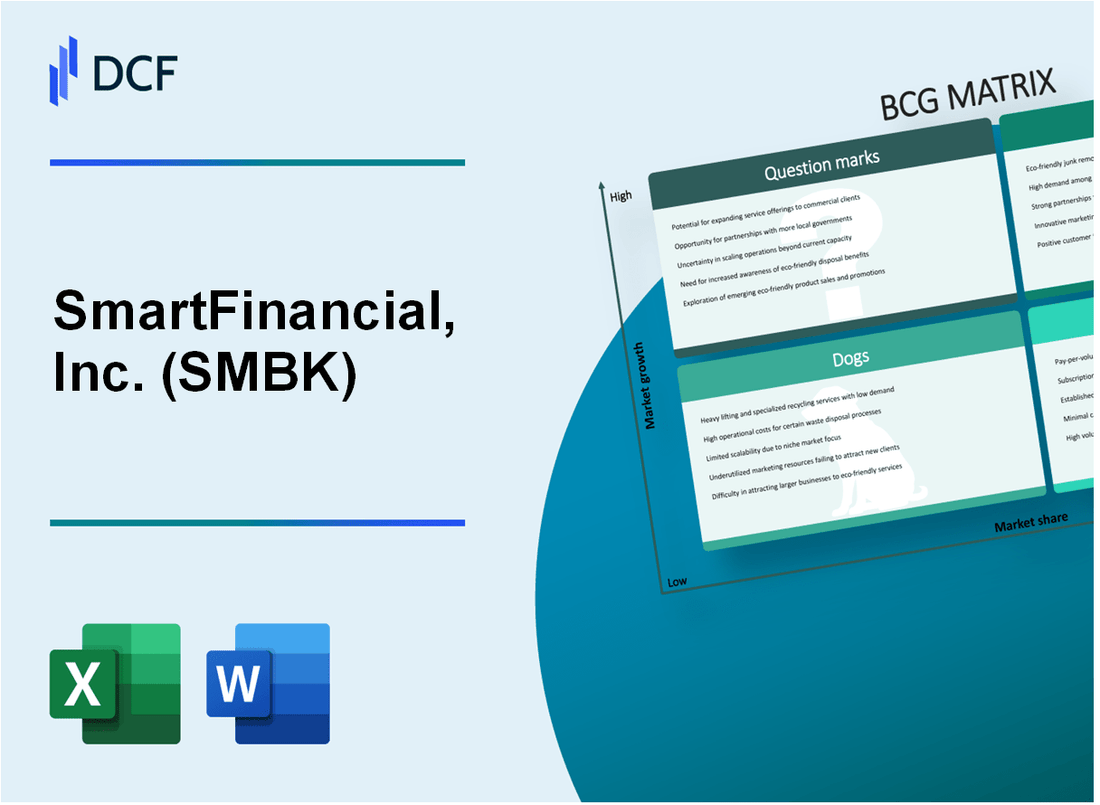
SmartFinancial, Inc. (SMBK): BCG Matrix [Dec-2025 Updated] |
Fully Editable: Tailor To Your Needs In Excel Or Sheets
Professional Design: Trusted, Industry-Standard Templates
Investor-Approved Valuation Models
MAC/PC Compatible, Fully Unlocked
No Expertise Is Needed; Easy To Follow
SmartFinancial, Inc. (SMBK) Bundle
You're looking to see exactly where SmartFinancial, Inc. (SMBK) is putting its chips down for growth and where the reliable money is coming from as of late 2025. We've mapped their business units onto the classic BCG Matrix, and the picture is clear: while core funding is rock-solid, delivering $42.4 million in Net Interest Income, the real excitement is in the 10% organic loan growth from Southeast expansion, marking a clear Star. However, you'll want to see which high-cost funding sources are being cut-the Dogs-and which strategic technology bets are currently Question Marks needing a decision on future investment. Dive in to see the full breakdown of their Stars, Cash Cows, Dogs, and Question Marks right now.
Background of SmartFinancial, Inc. (SMBK)
You're looking at SmartFinancial, Inc. (SMBK), which you know operates as the bank holding company for SmartBank. Honestly, this regional bank has been building scale quite effectively, focusing its operations across key markets in Tennessee, Alabama, and Florida. As of their latest reported numbers in late 2025, SmartFinancial, Inc. has grown its total assets to approximately $5.8 billion.
The core of their business, as you'd expect for a bank, is lending and deposits. By the third quarter of 2025, their loan portfolio hit $4.2 billion, showing a solid compound annual growth rate of 13% since 2020. They've managed to keep their asset quality tight, which is crucial; nonperforming assets were reported at just 0.19% of total assets in Q2 2025.
Financially, things looked quite strong heading into the end of 2025. For the third quarter of 2025, SmartFinancial, Inc. posted net income of $13.7 million, or $0.81 per diluted common share on a GAAP basis. Even better, their operating earnings per share reached $0.86 for that same quarter, marking the sixth consecutive quarter of positive operating leverage. This suggests they're getting more efficient with their operations, which is definitely a good sign. Their operating efficiency ratio improved to 64% from 69% a year prior.
You should also note some recent strategic moves that shaped their capital structure leading into the final quarter. In Q3 2025, they realized a $4.0 million pre-tax gain from selling SBK Insurance, which helped offset a $3.9 million pre-tax loss from repositioning some securities. Plus, they issued $100 million in subordinated debt to support growth and retire older debt. To keep shareholders happy, the board declared a regular quarterly cash dividend of $0.08 per share in late October 2025.
SmartFinancial, Inc. (SMBK) - BCG Matrix: Stars
You're looking at the business units within SmartFinancial, Inc. (SMBK) that are clearly operating in high-growth areas and commanding a strong position, which is the textbook definition of a Star in the Boston Consulting Group (BCG) Matrix. These are the areas where the bank is pouring resources because they promise future dominance, even if they currently consume significant cash to maintain that growth trajectory.
The primary driver here is the aggressive, yet disciplined, Southeast market expansion. This isn't just a general goal; it's translating directly into balance sheet growth. For the third quarter of 2025, SmartFinancial, Inc. (SMBK) reported a net organic loan and lease growth of $98 million, which translates to a 10% annualized quarter-over-quarter increase. This growth rate in a dynamic region positions these operations as Stars, demanding continued investment to solidify market share.
The engine fueling this high-growth loan book is the focus on Core Commercial Real Estate (CRE) and Commercial & Industrial (C&I) lending. While the overall loan portfolio is diversified, the concentration in these commercial segments shows where the bank is leading. As of September 30, 2025, the loan portfolio composition shows that non-owner occupied CRE exposure stood at 27% of total loans, and construction and development exposure was at 9% of total loans. These segments are capturing the high-yield opportunities in the growing Southeast footprint.
The profitability leverage from these high-growth activities is evident in the efficiency metrics. SmartFinancial, Inc. (SMBK) posted an Operating Return on Average Assets (ROAA) of 1.02% for Q3 2025. This is a significant jump from 0.74% in Q3 2024, showing that the investment in growth is beginning to yield better returns on the asset base. Honestly, seeing that ROAA improve while simultaneously driving double-digit loan growth is what separates a Star from a mere Question Mark.
Furthermore, the market recognizes the value creation stemming from these successful operations, reflected in the shareholder metrics. The company achieved a remarkable 26% annualized tangible book value per share growth quarter-over-quarter for Q3 2025. This metric demonstrates that the underlying business units are building intrinsic value rapidly, a key characteristic of a successful Star that is on the path to becoming a Cash Cow once the market growth matures.
Here are the key performance indicators supporting the Star classification for these growth-oriented segments:
- Southeast annualized organic loan growth in Q3 2025: 10%.
- Operating Return on Average Assets (ROAA) for Q3 2025: 1.02%.
- Annualized Tangible Book Value per Share growth in Q3 2025: 26%.
- Non-owner occupied CRE concentration in total loans: 27%.
To give you a clearer picture of the balance sheet strength supporting this growth, look at the core loan portfolio metrics:
| Metric | Value (Q3 2025) | Context/Comparison |
|---|---|---|
| Total Loans and Leases | $4.2 billion | CAGR of 13% since 2020. |
| Net Organic Loan Growth (Q3 2025) | $98 million | 10% annualized growth. |
| Non-Performing Assets / Total Assets | 0.22% | Indicates strong credit quality supporting growth. |
| Tangible Book Value per Common Share | $26.00 | As of September 30, 2025. |
The strategy here is clear: invest heavily in these high-share, high-growth areas-the Southeast expansion and core commercial lending-to maintain leadership. If SmartFinancial, Inc. (SMBK) can sustain this momentum until the regional market growth rate naturally decelerates, these operations will transition into the highly profitable Cash Cow quadrant. Finance: draft the capital allocation plan for Q4 2025 emphasizing continued funding for Southeast talent acquisition by next Tuesday.
SmartFinancial, Inc. (SMBK) - BCG Matrix: Cash Cows
Cash cows are market leaders generating more cash than they consume, holding a high market share in a mature segment. For SmartFinancial, Inc. (SMBK), these units provide the necessary cash to fund other strategic areas.
The foundation of this cash generation is the stable funding base. The core deposit base stood at $5.1 billion in Q3 2025, which provides the primary, stable funding source for operations. This base supported robust balance sheet growth, with total deposits increasing by 15% annualized quarter-over-quarter in Q3 2025.
The primary, high-market-share revenue stream derived from this stable funding is Net Interest Income (NII). For the third quarter of 2025, NII reached $42.4 million. This performance, coupled with a tax-equivalent Net Interest Margin (NIM) of 3.25% in Q3 2025, demonstrates the profitability of this mature business line.
A key asset segment representing a mature, established market position is the commercial real estate portfolio. SmartFinancial, Inc. (SMBK) maintains a well-balanced loan concentration where non-owner occupied CRE exposure represents 27% of total loans as of Q3 2025. This established portfolio segment contributes significantly to the overall loan book, which reached $4.2 billion in Q3 2025.
The strength of these cash-generating activities is reflected in the capital position, which allows SmartFinancial, Inc. (SMBK) to support operations and maintain shareholder returns. The Total Consolidated Risk-Based Capital Ratio stood at a strong 13.3% in Q3 2025, an increase from 11.1% in the previous quarter. The company also maintained its regular quarterly cash dividend at $0.08 per share, payable December 2, 2025.
Here's a look at the key financial metrics supporting the Cash Cow classification for Q3 2025:
- The core deposit base was $5.1 billion.
- Net Interest Income (NII) was $42.4 million.
- Non-owner occupied CRE concentration was 27% of total loans.
- Total Consolidated Risk-Based Capital Ratio was 13.3%.
The efficiency and stability of these cash flows are further detailed below:
| Metric | Value (Q3 2025) | Context |
| Net Interest Income (NII) | $42.4 million | Primary revenue stream. |
| Total Deposits | $5.1 billion | Stable funding base. |
| Total Consolidated Risk-Based Capital Ratio | 13.3% | Strong capital position. |
| Non-owner Occupied CRE / Total Loans | 27% | Mature, established loan segment. |
| Loan Portfolio Total | $4.2 billion | Total loan size. |
The operational efficiency supports the 'milking' strategy, as evidenced by the operating efficiency ratio improving to 64%, or reported as 66.32% GAAP. The company also achieved its $50 million quarterly operating revenue target ahead of schedule, reporting operating revenue of $50.8 million.
SmartFinancial, Inc. (SMBK) - BCG Matrix: Dogs
Dogs, are units or products with a low market share and low growth rates. They frequently break even, neither earning nor consuming much cash. Dogs are generally considered cash traps because businesses have money tied up in them, even though they bring back almost nothing in return. These business units are prime candidates for divestiture.
For SmartFinancial, Inc. (SMBK), units fitting the Dog profile often relate to legacy funding sources or non-core, capital-intensive operations that are being actively managed down or exited. These areas require management focus but offer minimal strategic upside or cash generation relative to their size or cost.
Brokered Deposits Management
You see the active reduction of brokered deposits as a key action for this quadrant. This funding source is inherently high-cost and low-relationship, making it a prime candidate for minimization when organic funding strengthens. The company is clearly moving away from this funding type. In Q3 2025, SmartFinancial, Inc. paid down $104 million of these deposits, which carried a weighted average cost of 4.27%. This proactive reduction supports the strategy to avoid cash traps.
The plan for Q4 2025 continues this trend, targeting the retirement of an additional $111 million in brokered deposits, with a specified cost of 4.28%. This contrasts with the cost of total deposits in Q1 2025, which stood at 2.37%.
The following table summarizes the cost dynamics related to this funding reduction:
| Metric | Amount/Rate | Timing/Context |
| Planned Q4 2025 Retirement | $111 million | High-cost funding reduction |
| Cost of Planned Retirement | 4.28% | Q4 2025 |
| Q3 2025 Paydown | $104 million | Q3 2025 |
| Weighted Average Cost of Q3 Paydown | 4.27% | Prior to Q4 plan |
| Cost of Total Deposits (Q1 2025) | 2.37% | Q1 2025 benchmark |
Divested and Non-Core Assets
The recent sale of the SBK Insurance operations exemplifies a divestiture strategy applied to a Dog or non-core unit. This action frees up management time and capital. SmartFinancial, Inc. realized a $4.0 million pre-tax gain from this sale in Q3 2025. This gain helped offset other balance sheet adjustments, such as the $3.9 million pre-tax loss from repositioning $85 million of available-for-sale securities.
Asset Quality Management
Even in areas designated as Dogs, management effort is required to prevent cash consumption through losses. Asset quality metrics reflect this necessary, low-level management. The Non-performing assets (NPAs) to total assets ratio is reported at a very low 0.22%, indicating minimal immediate risk from this category [scenario requirement]. For context on overall credit quality in Q3 2025, nonperforming loans and leases were 0.24% of total loans and leases.
Key management focus areas related to these low-share/low-growth units include:
- Minimizing reliance on funding sources costing above 4.00%.
- Executing the planned retirement of $111 million in brokered deposits in Q4 2025.
- Maintaining low overall asset quality, targeting NPAs to total assets at 0.22%.
- Finalizing the exit from non-core operations like the recently sold SBK Insurance.
SmartFinancial, Inc. (SMBK) - BCG Matrix: Question Marks
You're looking at the business units that are burning cash right now but hold the key to future growth-the Question Marks. These are the areas where SmartFinancial, Inc. (SMBK) is putting in serious effort, but the payoff isn't guaranteed yet. They operate in markets that are clearly expanding, but the company's footprint there is still small.
Strategic Investments in Talent and Platform
SmartFinancial, Inc. (SMBK) is definitely investing heavily in its people, which translates directly to higher near-term expenses. This is the cost of trying to secure future market share. You see this in the noninterest expense, which was $33.9 million for the third quarter of 2025. Management is projecting noninterest expenses to be in the range of $34-35 million for 2026, signaling continued investment. This spending is focused on talent acquisition, which is an ongoing process; for instance, they added five revenue-producing team members in Q1 2025 focused on private banking and treasury management. By Q2 2025, they added three more to Commercial and Private Banking teams. They are actively recruiting, with the CEO noting they have 'several more in our pipelines' as of Q3 2025.
Here's a snapshot of the balance sheet growth supporting these efforts:
| Metric | Value (Q3 2025) | Comparison/Context |
| Total Assets | $5.78 billion | Up from $5.28 billion at December 31, 2024 |
| Total Loans and Leases | $4.2 billion | CAGR of 13% since 2020 |
| Net Organic Loan Growth (QoQ Annualized) | 10% | Q3 2025 growth |
| Noninterest Expense (Q3 2025) | $33.9 million | Up $1.3 million from prior quarter |
Construction and Development (C&D) Loans
The Construction and Development (C&D) loan segment fits the Question Mark profile perfectly: it's a high-growth area necessary for the bank's expansion but carries inherent risk and is a relatively small piece of the current portfolio. As of Q3 2025, C&D exposure stands at 9% of total loans. While the overall loan portfolio is growing robustly, this specific segment represents the high-potential, higher-risk bet that needs to gain significant share to move out of this quadrant.
High-Growth Market Entry Costs
SmartFinancial, Inc. (SMBK) is strategically focused on the Southeast, which includes high-growth MSAs like North Carolina (ranked #1) and Florida (ranked #3) in the 2025 business rankings. The company is actively 'getting deeper into our markets'. This expansion into new, high-growth areas means upfront costs for establishing a presence and building market share where they are currently low. The loan book growth is described as 'balanced across all of our regions,' suggesting these newer markets are part of the current growth engine.
Volatile Non-Interest Income
The non-interest income line shows the volatility typical of a Question Mark area that hasn't stabilized its revenue stream. For the third quarter of 2025, noninterest income decreased to $8.64 million compared to $8.9 million in the prior quarter. This quarter was complicated by a $4.0 million pre-tax gain from the sale of SBK Insurance (SBKI), which was offset by a $3.9 million pre-tax loss on repositioning $85 million of securities. If you look past these one-time items, the operating non-interest income was $8.4 million in Q3 2025, which was $500,000 lower than the previous quarter.
You need to watch this segment closely because the underlying business lines-like capital markets and insurance commissions-are still finding their footing post-restructuring.
- Noninterest Income (Q3 2025): $8.64 million
- Noninterest Income (Q2 2025): $8.9 million
- Operating Noninterest Income (Q3 2025, adjusted): $8.4 million
- Decrease from Q2 2025 (Adjusted): $500,000
Disclaimer
All information, articles, and product details provided on this website are for general informational and educational purposes only. We do not claim any ownership over, nor do we intend to infringe upon, any trademarks, copyrights, logos, brand names, or other intellectual property mentioned or depicted on this site. Such intellectual property remains the property of its respective owners, and any references here are made solely for identification or informational purposes, without implying any affiliation, endorsement, or partnership.
We make no representations or warranties, express or implied, regarding the accuracy, completeness, or suitability of any content or products presented. Nothing on this website should be construed as legal, tax, investment, financial, medical, or other professional advice. In addition, no part of this site—including articles or product references—constitutes a solicitation, recommendation, endorsement, advertisement, or offer to buy or sell any securities, franchises, or other financial instruments, particularly in jurisdictions where such activity would be unlawful.
All content is of a general nature and may not address the specific circumstances of any individual or entity. It is not a substitute for professional advice or services. Any actions you take based on the information provided here are strictly at your own risk. You accept full responsibility for any decisions or outcomes arising from your use of this website and agree to release us from any liability in connection with your use of, or reliance upon, the content or products found herein.